Just two weeks ago, we discussed a level of potential support that traders were eying in the S&P 500. Today, we’re sitting just above that level, so it’s worth revisiting the chart. 🗺️
We initially discussed traders and investors identifying a confluence of technical “levels” and indicators in the $410-$420 range of the S&P 500 ETF $SPY. As we pointed out last time, not only is the market’s May breakout level near 420 but so is the volume-weighted average price from its 2022 highs and 2022 lows.
And with buyers stepping in over the last few days, chatter is beginning to build that this area could stem the recent 10% pullback. 🗫
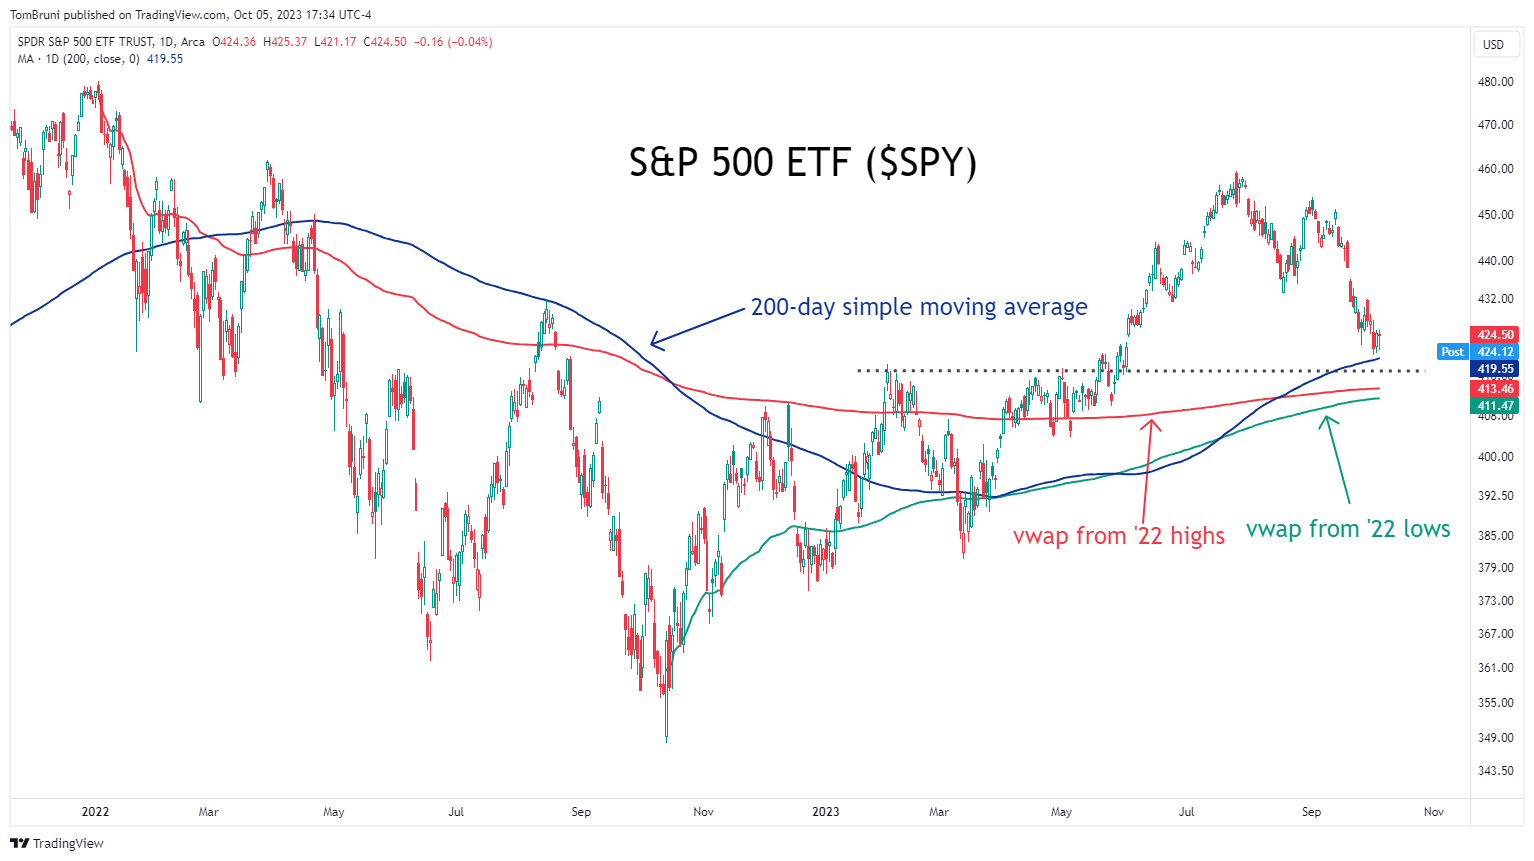
Last time, we didn’t include the 200-day simple moving average, which we’ve added in blue. Market participants often use this indicator to gauge the market’s long-term trend by smoothing out the price action from the last year or so. And depending on who you ask, it sometimes “acts as” an important inflection point for the market. As a result, it’s in focus as well. 👀
Tomorrow is the September nonfarm payroll number, which will likely move the market and set the trend for the coming week. With this big technical area right below current prices, expect a lot of buying and selling to occur in this area.
Buyers are certainly fishing for a bottom, so we’ll have to see if they can reel the market in over these next few days. Or if they end up getting pulled overboard. 🎣