For seemingly no good reason, the stock market experienced its first bout of volatility in several weeks today. The sharp turnaround had some latecomers to the party asking how this could happen to them. As such, it seems like a good time to update our handy S&P 500 roadmap we’ve shared throughout the year. 🗺️
The last time we checked in on this was in early November when stocks found support at a confluence of “technical” levels that many market participants were watching. Since then, it’s been quite the wild ride, with the S&P 500 rallying over 16% in about eight weeks and approaching its all-time highs from 2022.
So where could things be headed next? 🤔
Well, most technical analysts agree that the recent advance has been excessively sharp and is unlikely to continue in the same fashion into 2024. They theorize that with the stock market back in a firm uptrend and up mightily for 2022, today was the start of some profit-taking.
Regardless of what indicator you’re using to measure trend and market positioning, they all show that most buyers of stocks over the last two years are in the green. So, with that in mind, many are beginning the process of trimming their winners, harvesting tax losses on losers, and preparing their portfolios for the new year. 💰
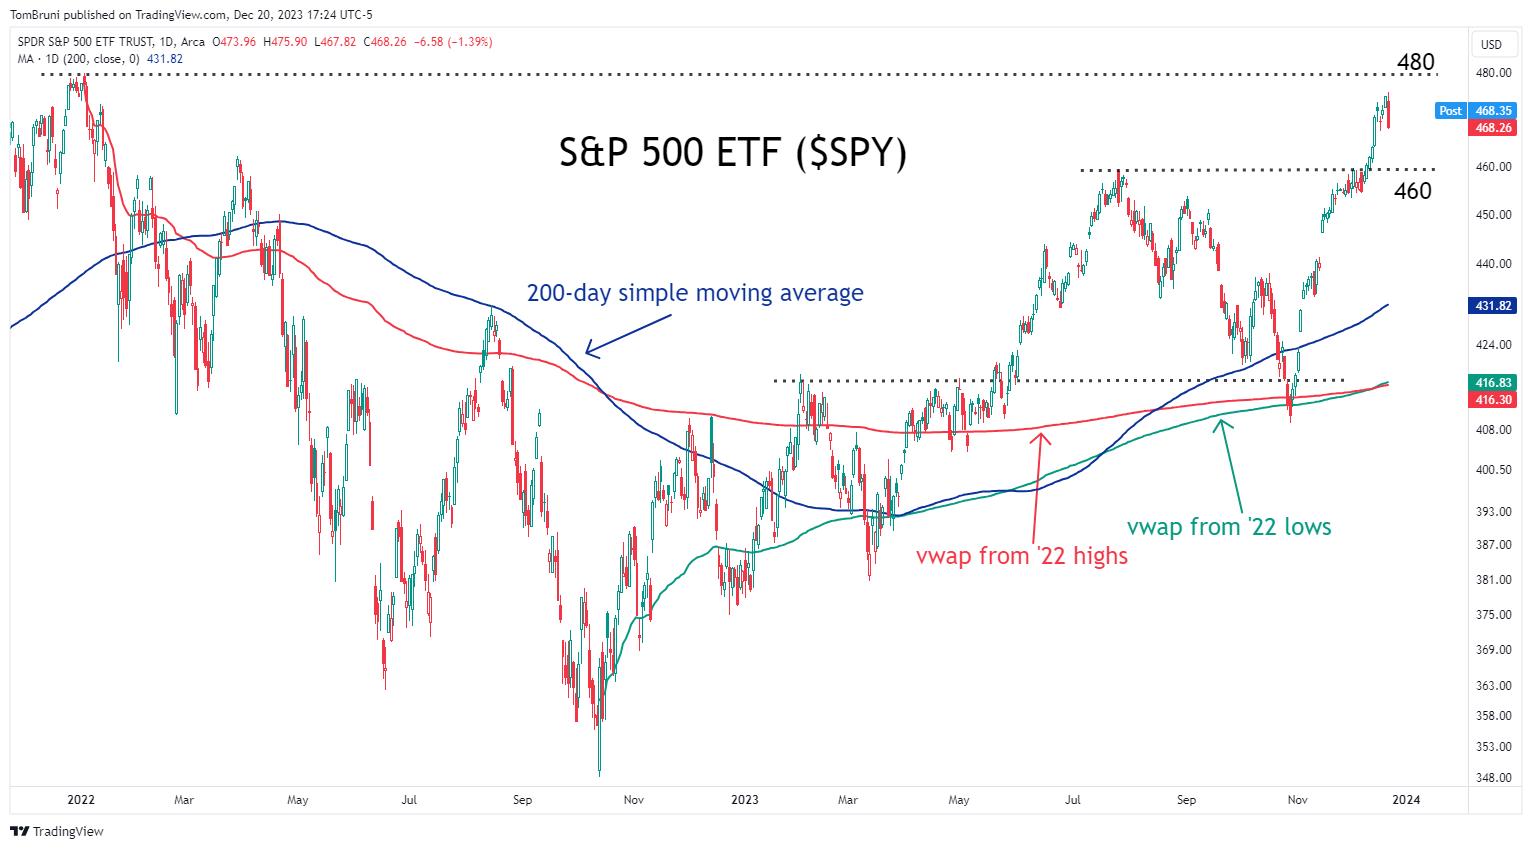
What does that mean for prices going forward? Technical analysts are looking for the market to establish a new trading range as it digests the recent gains and resets for 2024. With resistance at all-time highs near 480 and a clear breakout level below us at 460, many traders are using those levels as points of reference. 🧭
They suggest that prices stabilizing above 460 would allow stocks to breathe while not negating the market’s positive medium and long-term momentum. However, if prices do break that level of support, then a deeper pullback towards the market’s 200-day moving average (in blue) in the 430 area would come into focus.
As always, we’ll have to see how it shakes out. But this roadmap has served our community well throughout the year and continues to appear when traders suspect we’re near an inflection point.