


Advertisement|Remove ads.
Granules India Shares: Technical Charts Hint At Trend Reversal, Says SEBI RA Deepak Pal


Granules India shares have fallen 7% over the last month; however, their technical charts are indicating a short-term trend reversal.
SEBI-registered analyst Deepak Pal+ noted that on its daily chart, the stock had been trading below its 14 & 55-day Exponential Moving Average (EMA) since June 24th, indicating short-term weakness.
Granules India stock is facing consistent resistance at its 55-day EMA on the daily chart and around its 14-day EMA on the weekly chart. However, he noted that the stock was taking strong support near the ₹475 level.
On June 19th and 20th, the stock hit lows of around ₹479 and subsequently witnessed a reversal. Even on Thursday, the stock traded in a narrow range, opening at ₹492, making a high of ₹495, a low of ₹487.45, and closing at ₹490.15.
On the daily chart, Pal flagged that a triangle pattern is forming, and both technical indicators – Moving Average Convergence Divergence (MACD) and Relative Strength Index (RSI) – are indicating a short-term positive trend.
He suggested that traders can consider fresh entries with the stock trading near ₹490, with a stop loss of ₹475. If the stock sustains this support and breaks above the resistance zone, it could quickly move towards ₹525 levels in the near term.
Fundamentally, Granules India holds a dominant position in key products such as Paracetamol and Ibuprofen, and is steadily expanding its portfolio of high-margin, complex generics. The company’s regulatory approvals position it well for future growth, and improving debt profile highlights its financial strength.
Despite near-term challenges, it remains a fundamentally sound player in the Indian pharmaceutical sector, with promising long-term growth potential, he concluded.
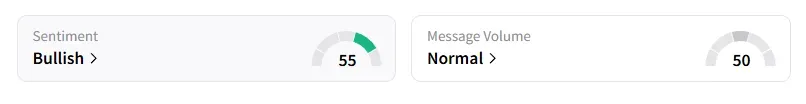
Data on Stocktwits shows that retail sentiment is ‘bullish’ on this counter.
Granules India shares have fallen 17% year-to-date (YTD).
For updates and corrections, email newsroom[at]stocktwits[dot]com.
Latest News
/filters:format(webp)https://news.stocktwits-cdn.com/Getty_Images_2218096416_jpg_9d469a2ec6.webp)
/filters:format(webp)https://news.stocktwits-cdn.com/jaiveer_jpg_280ad67f36.webp) Jaiveer Shekhawat·7m ago
Jaiveer Shekhawat·7m ago/filters:format(webp)https://st-everywhere-cms-prod.s3.us-east-1.amazonaws.com/large_sealsq_stock_market_representative_resized_b05435011f.jpg)
/filters:format(webp)https://st-everywhere-cms-prod.s3.us-east-1.amazonaws.com/unnamed_jpg_9dff551b50.webp) Anan Ashraf·26m ago
Anan Ashraf·26m ago/filters:format(webp)https://news.stocktwits-cdn.com/Getty_Images_2229019640_jpg_c6006d7238.webp) Jaiveer Shekhawat·57m ago
Jaiveer Shekhawat·57m ago/filters:format(webp)https://st-everywhere-cms-prod.s3.us-east-1.amazonaws.com/large_adam_smigielski_K5m_Pt_O_Nmp_HM_unsplash_f365ee93f4.jpg) Jaiveer Shekhawat·1h ago
Jaiveer Shekhawat·1h ago/filters:format(webp)https://news.stocktwits-cdn.com/large_trump_jpg_fc59d30bbe.webp)
/filters:format(webp)https://news.stocktwits-cdn.com/Aashika_Suresh_Profile_Picture_jpg_2acd6f446c.webp) Aashika Suresh·2h ago
Aashika Suresh·2h ago/filters:format(webp)https://news.stocktwits-cdn.com/large_Getty_Images_1190665957_jpg_92088206ed.webp) Jaiveer Shekhawat·2h ago
Jaiveer Shekhawat·2h ago