


Advertisement|Remove ads.
NTPC Nears Breakout Zone As Symmetrical Triangle Tightens: SEBI RA Vikash Bagaria Sees Bullish Setup


NTPC Ltd shows initial indicators of a bullish breakout from its symmetrical triangle pattern, according to SEBI-registered analyst Vikash Bagaria.
At the time of writing, NTPC shares were trading at ₹338.45, down 1.47% or ₹5.05 on the day.
According to Bagaria, the stock has recently surpassed the critical 0.5 Fibonacci retracement level near ₹345, confirming a sentiment shift after enduring range contraction.
He added that the new MACD crossover and the rising Relative Strength Index (RSI) indicate a strengthening bullish momentum.
NTPC shows technical signs of maintaining its position above its 200-day Exponential Moving Average (DEMA), an essential indicator of long-term trend strength.
Bagaria predicts more substantial bullish potential for NTPC if its price stays above ₹350 while targeting ₹385 and ₹410 as potential high points.
To protect against downside risk, he suggests establishing a stop-loss at ₹336, which lies below the triangle support level.
According to the analyst, the most recent trade data shows the stock approaching its breakout threshold alongside technical indicators that suggest an upward trend may occur if purchasing activity persists.
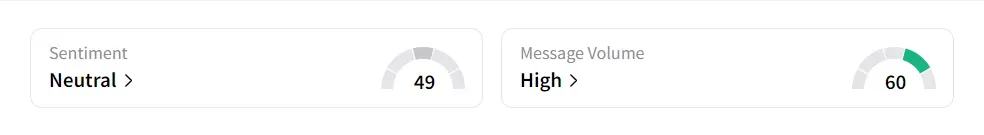
On Stocktwits, retail sentiment was ‘neutral’ amid ‘high’ message volume.
The stock has risen 1.4% so far in 2025.
For updates and corrections, email newsroom[at]stocktwits[dot]com.
Latest News
/filters:format(webp)https://st-everywhere-cms-prod.s3.us-east-1.amazonaws.com/large_adam_smigielski_K5m_Pt_O_Nmp_HM_unsplash_f365ee93f4.jpg)
/filters:format(webp)https://news.stocktwits-cdn.com/jaiveer_jpg_280ad67f36.webp) Jaiveer Shekhawat·15m ago
Jaiveer Shekhawat·15m ago/filters:format(webp)https://news.stocktwits-cdn.com/large_trump_jpg_fc59d30bbe.webp)
/filters:format(webp)https://news.stocktwits-cdn.com/Aashika_Suresh_Profile_Picture_jpg_2acd6f446c.webp) Aashika Suresh·33m ago
Aashika Suresh·33m ago/filters:format(webp)https://news.stocktwits-cdn.com/large_Getty_Images_1190665957_jpg_92088206ed.webp) Jaiveer Shekhawat·48m ago
Jaiveer Shekhawat·48m ago/filters:format(webp)https://news.stocktwits-cdn.com/large_Getty_Images_2235337192_jpg_56c00409cf.webp)
/filters:format(webp)https://st-everywhere-cms-prod.s3.us-east-1.amazonaws.com/unnamed_jpg_9dff551b50.webp) Anan Ashraf·49m agoAashika Suresh·1h ago
Anan Ashraf·49m agoAashika Suresh·1h ago/filters:format(webp)https://news.stocktwits-cdn.com/large_Getty_Images_2232147590_jpg_a31aecbfad.webp) Jaiveer Shekhawat·1h ago
Jaiveer Shekhawat·1h ago