Holy Commodities Batman

We can’t not look at how insanely high some commodities have moved. 

Frozen Orange Juice Futures

Orange Juice Monthly Chart – Click to enlarge.

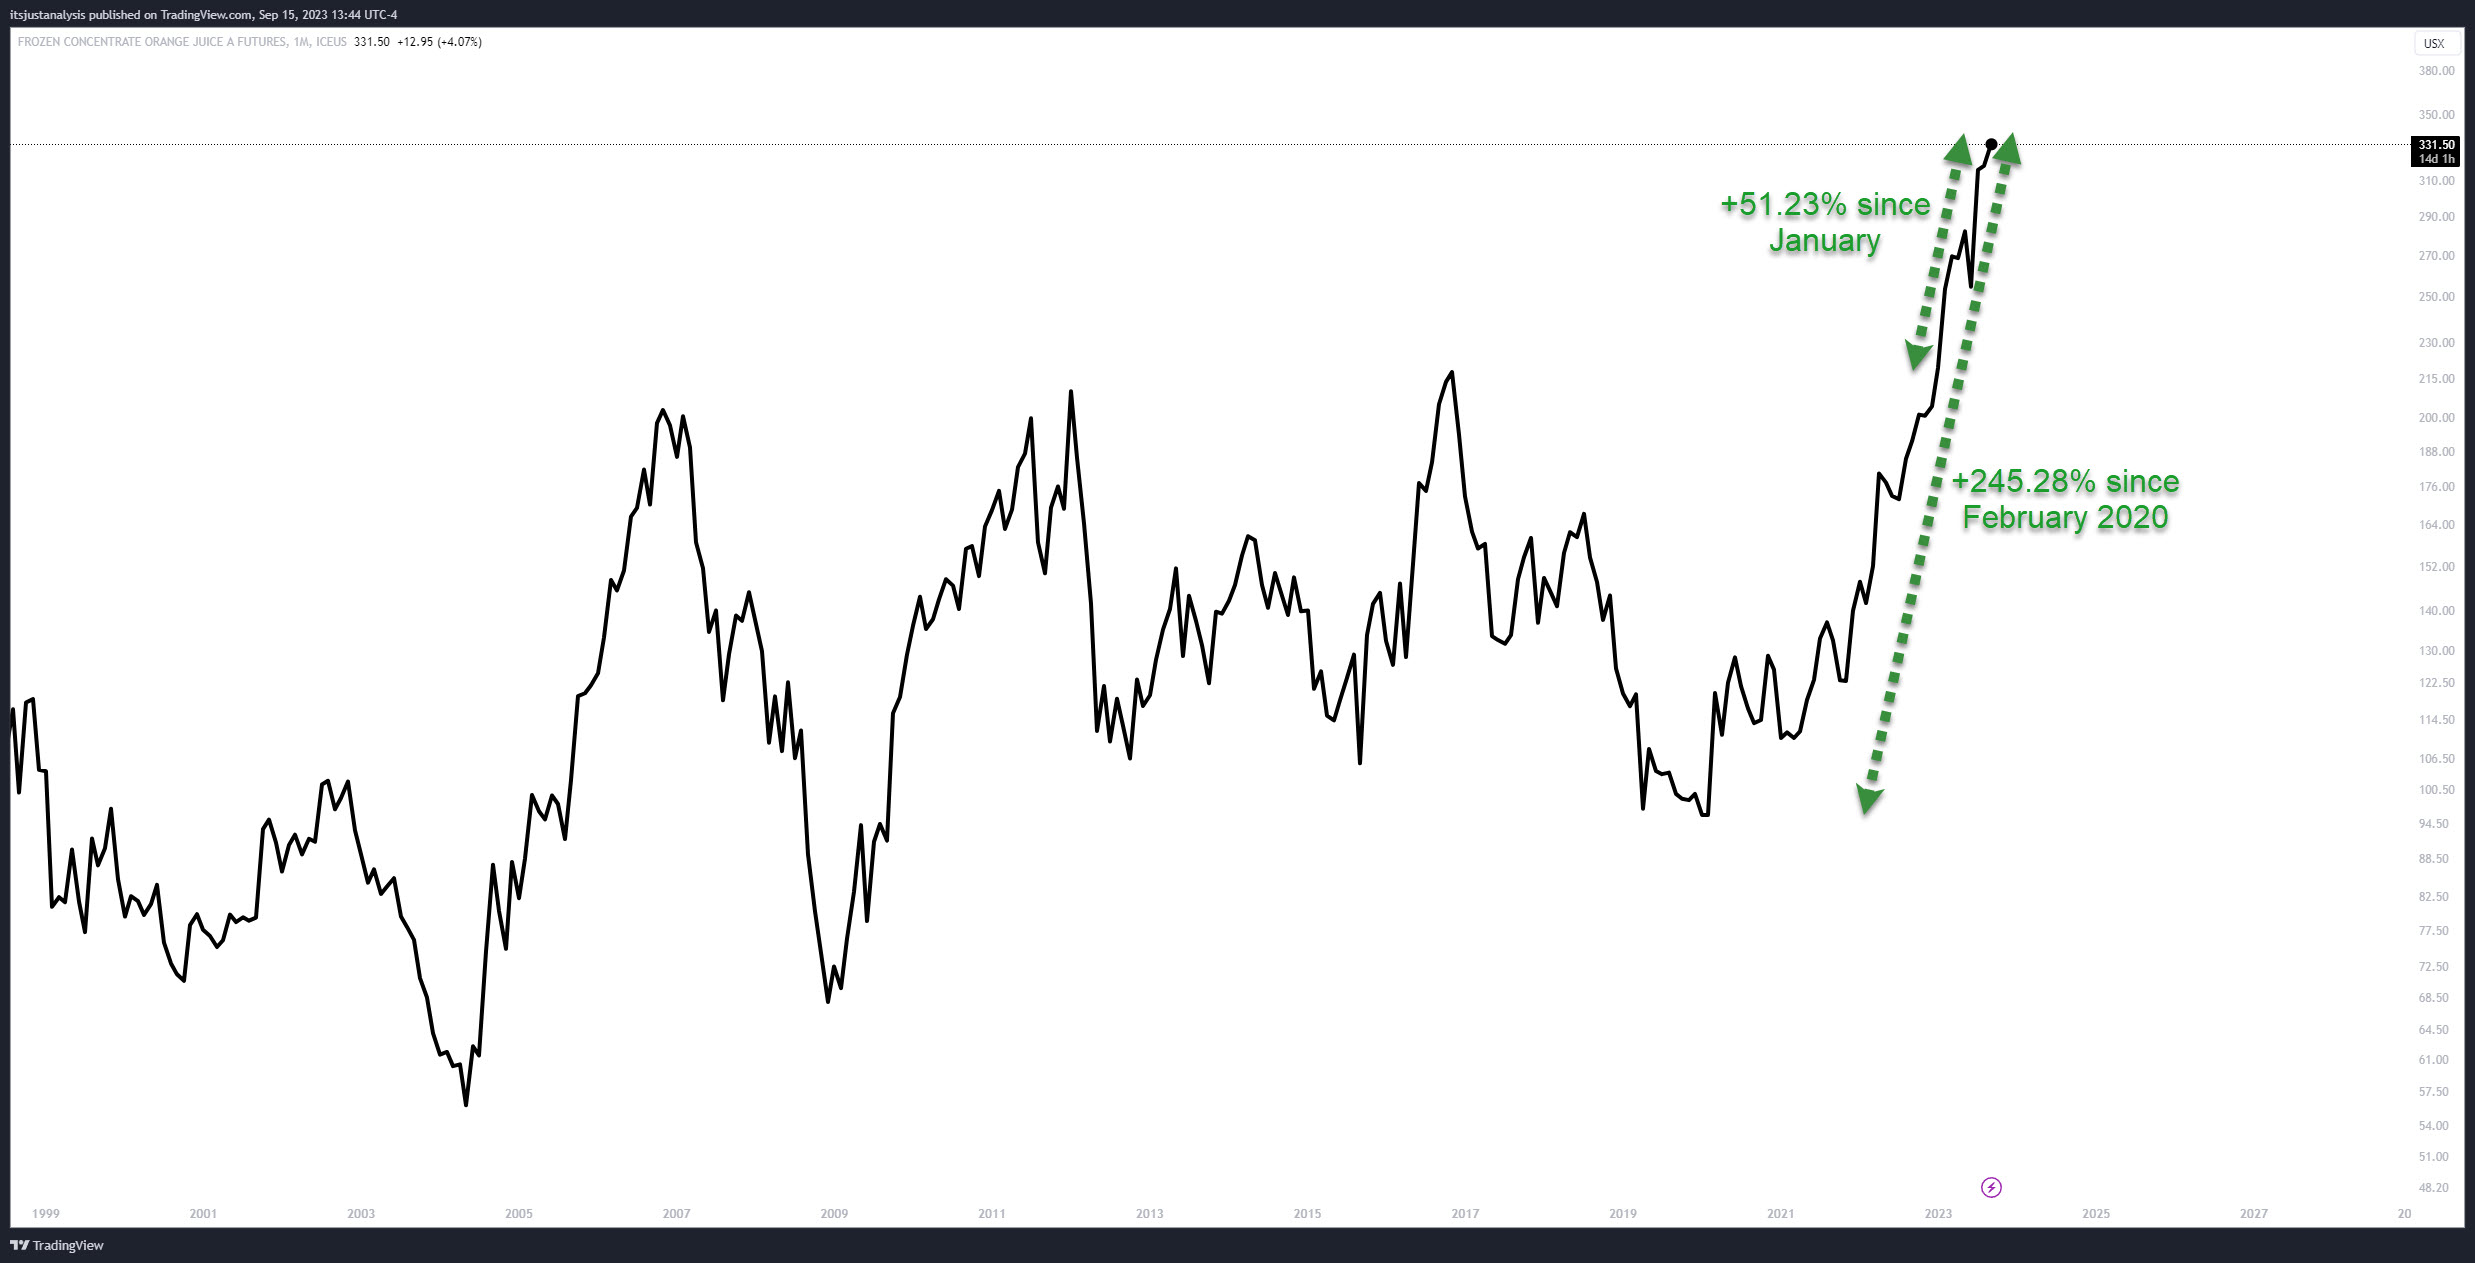
New all-time highs and up nearly +250% since February 2020. 

The only thing more freshly squeezed is my wallet. 🍊

Cocoa Futures

Cocoa Monthly Chart – Click to enlarge.

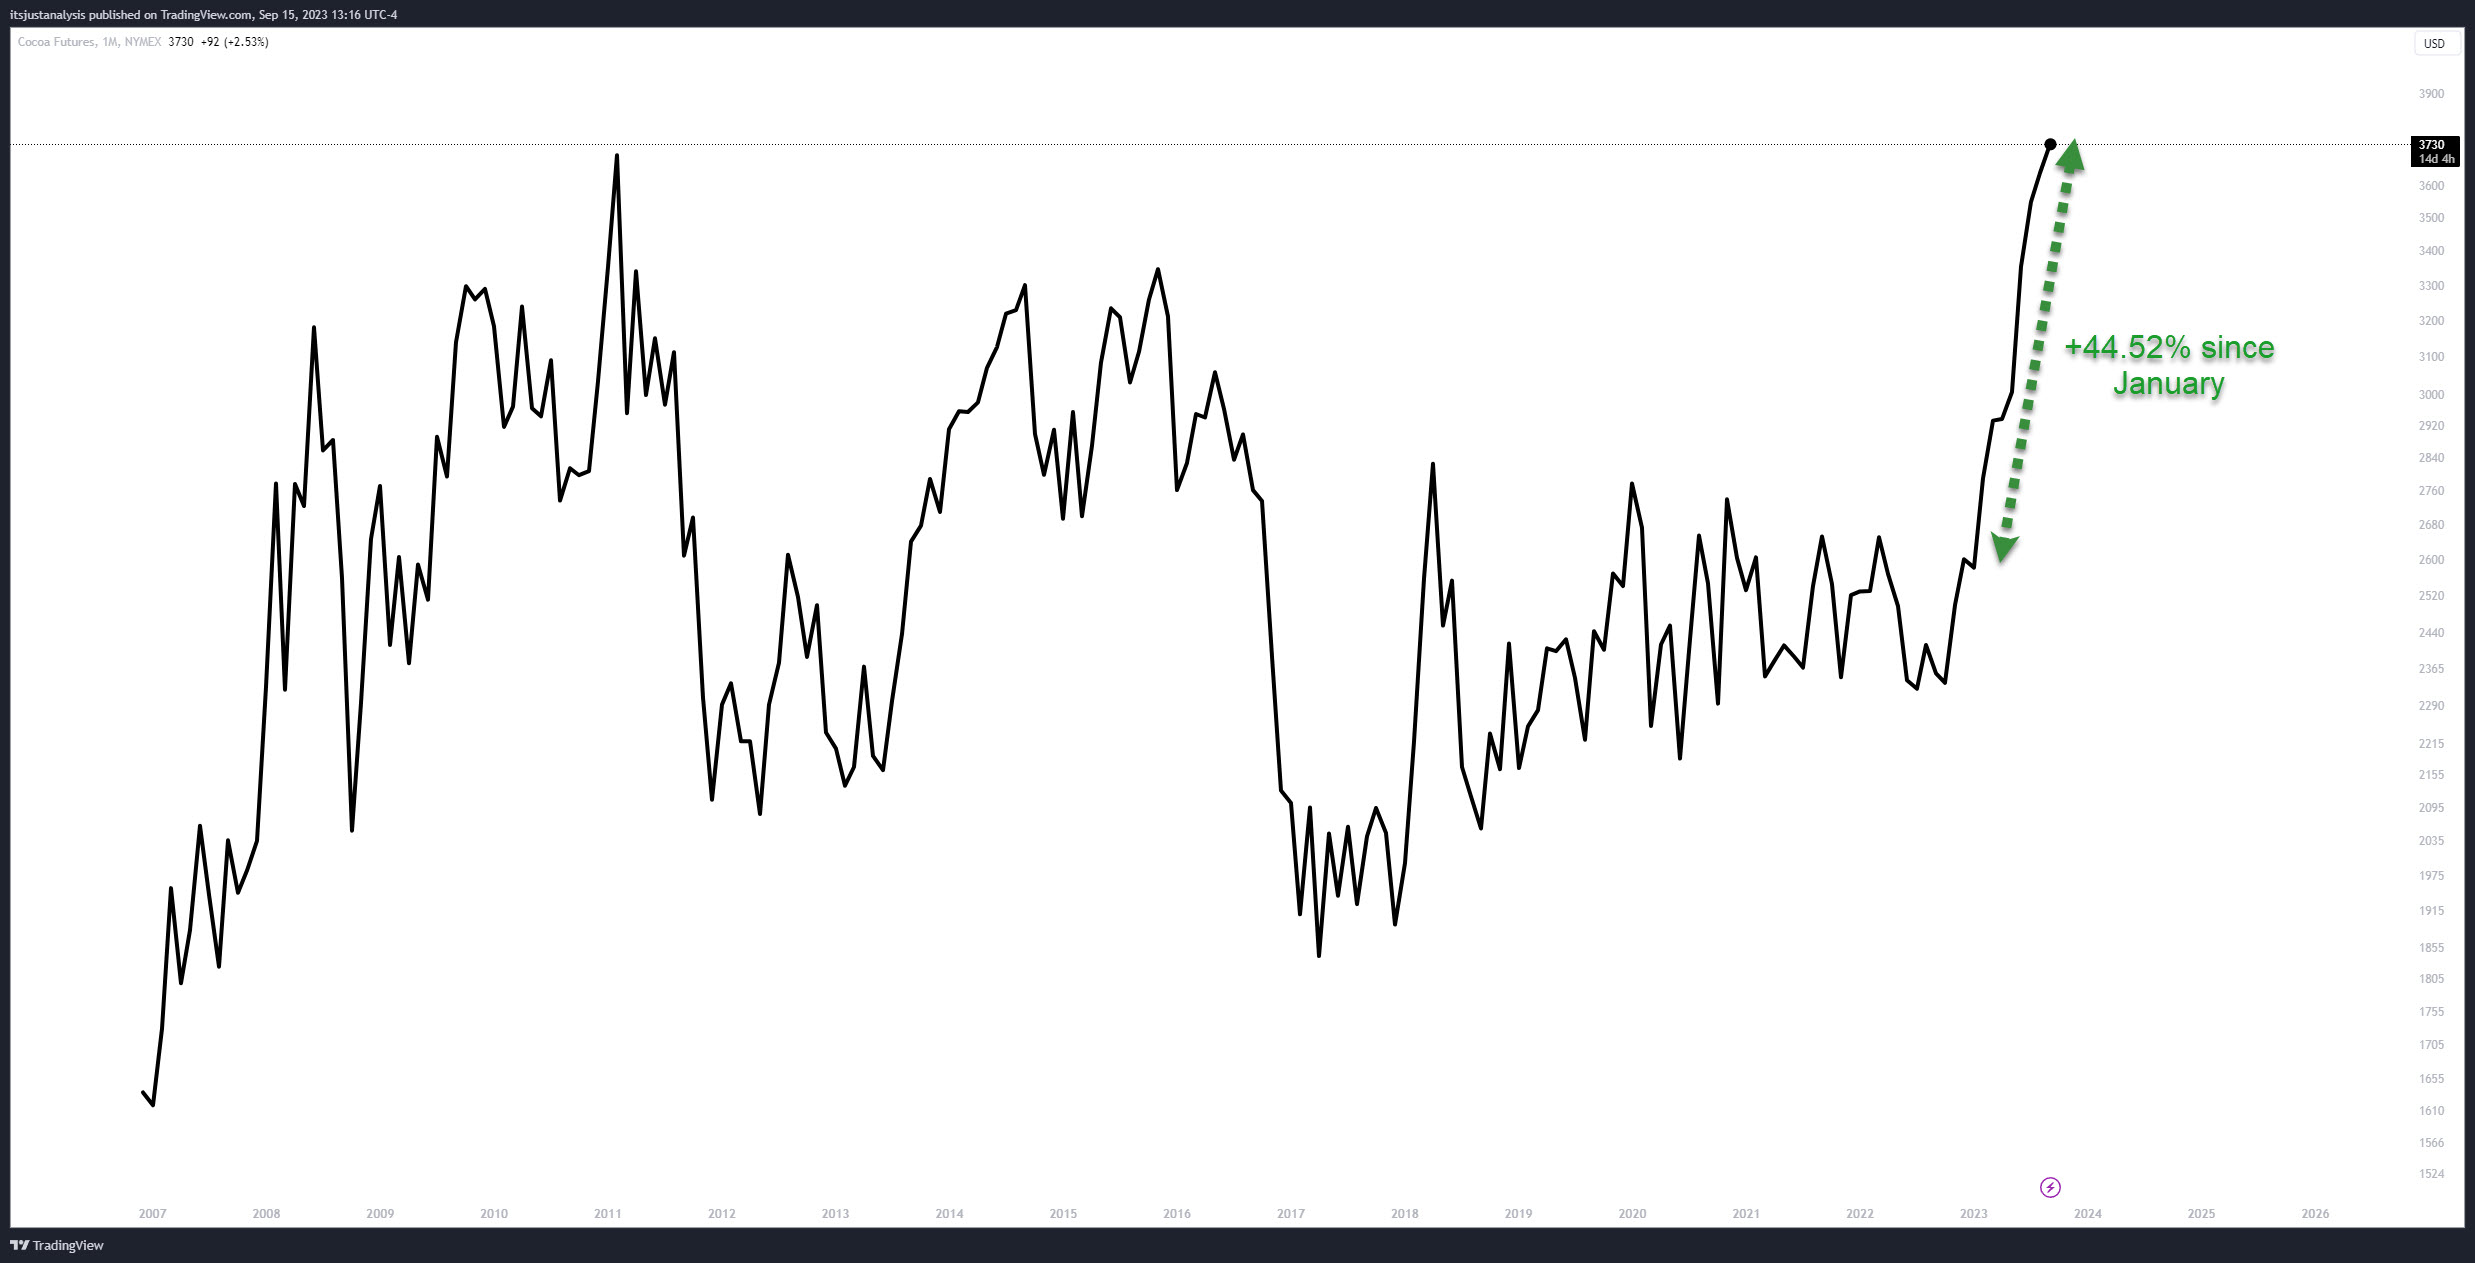
Not only are cocoa futures up over 44% since the beginning of the year, it’s trading at new all-time highs. 

Valentine’s Day 2024 just got a lot more expensive.🍫

Live Cattle Futures

Live Cattle Juice Monthly Chart – Click to enlarge.

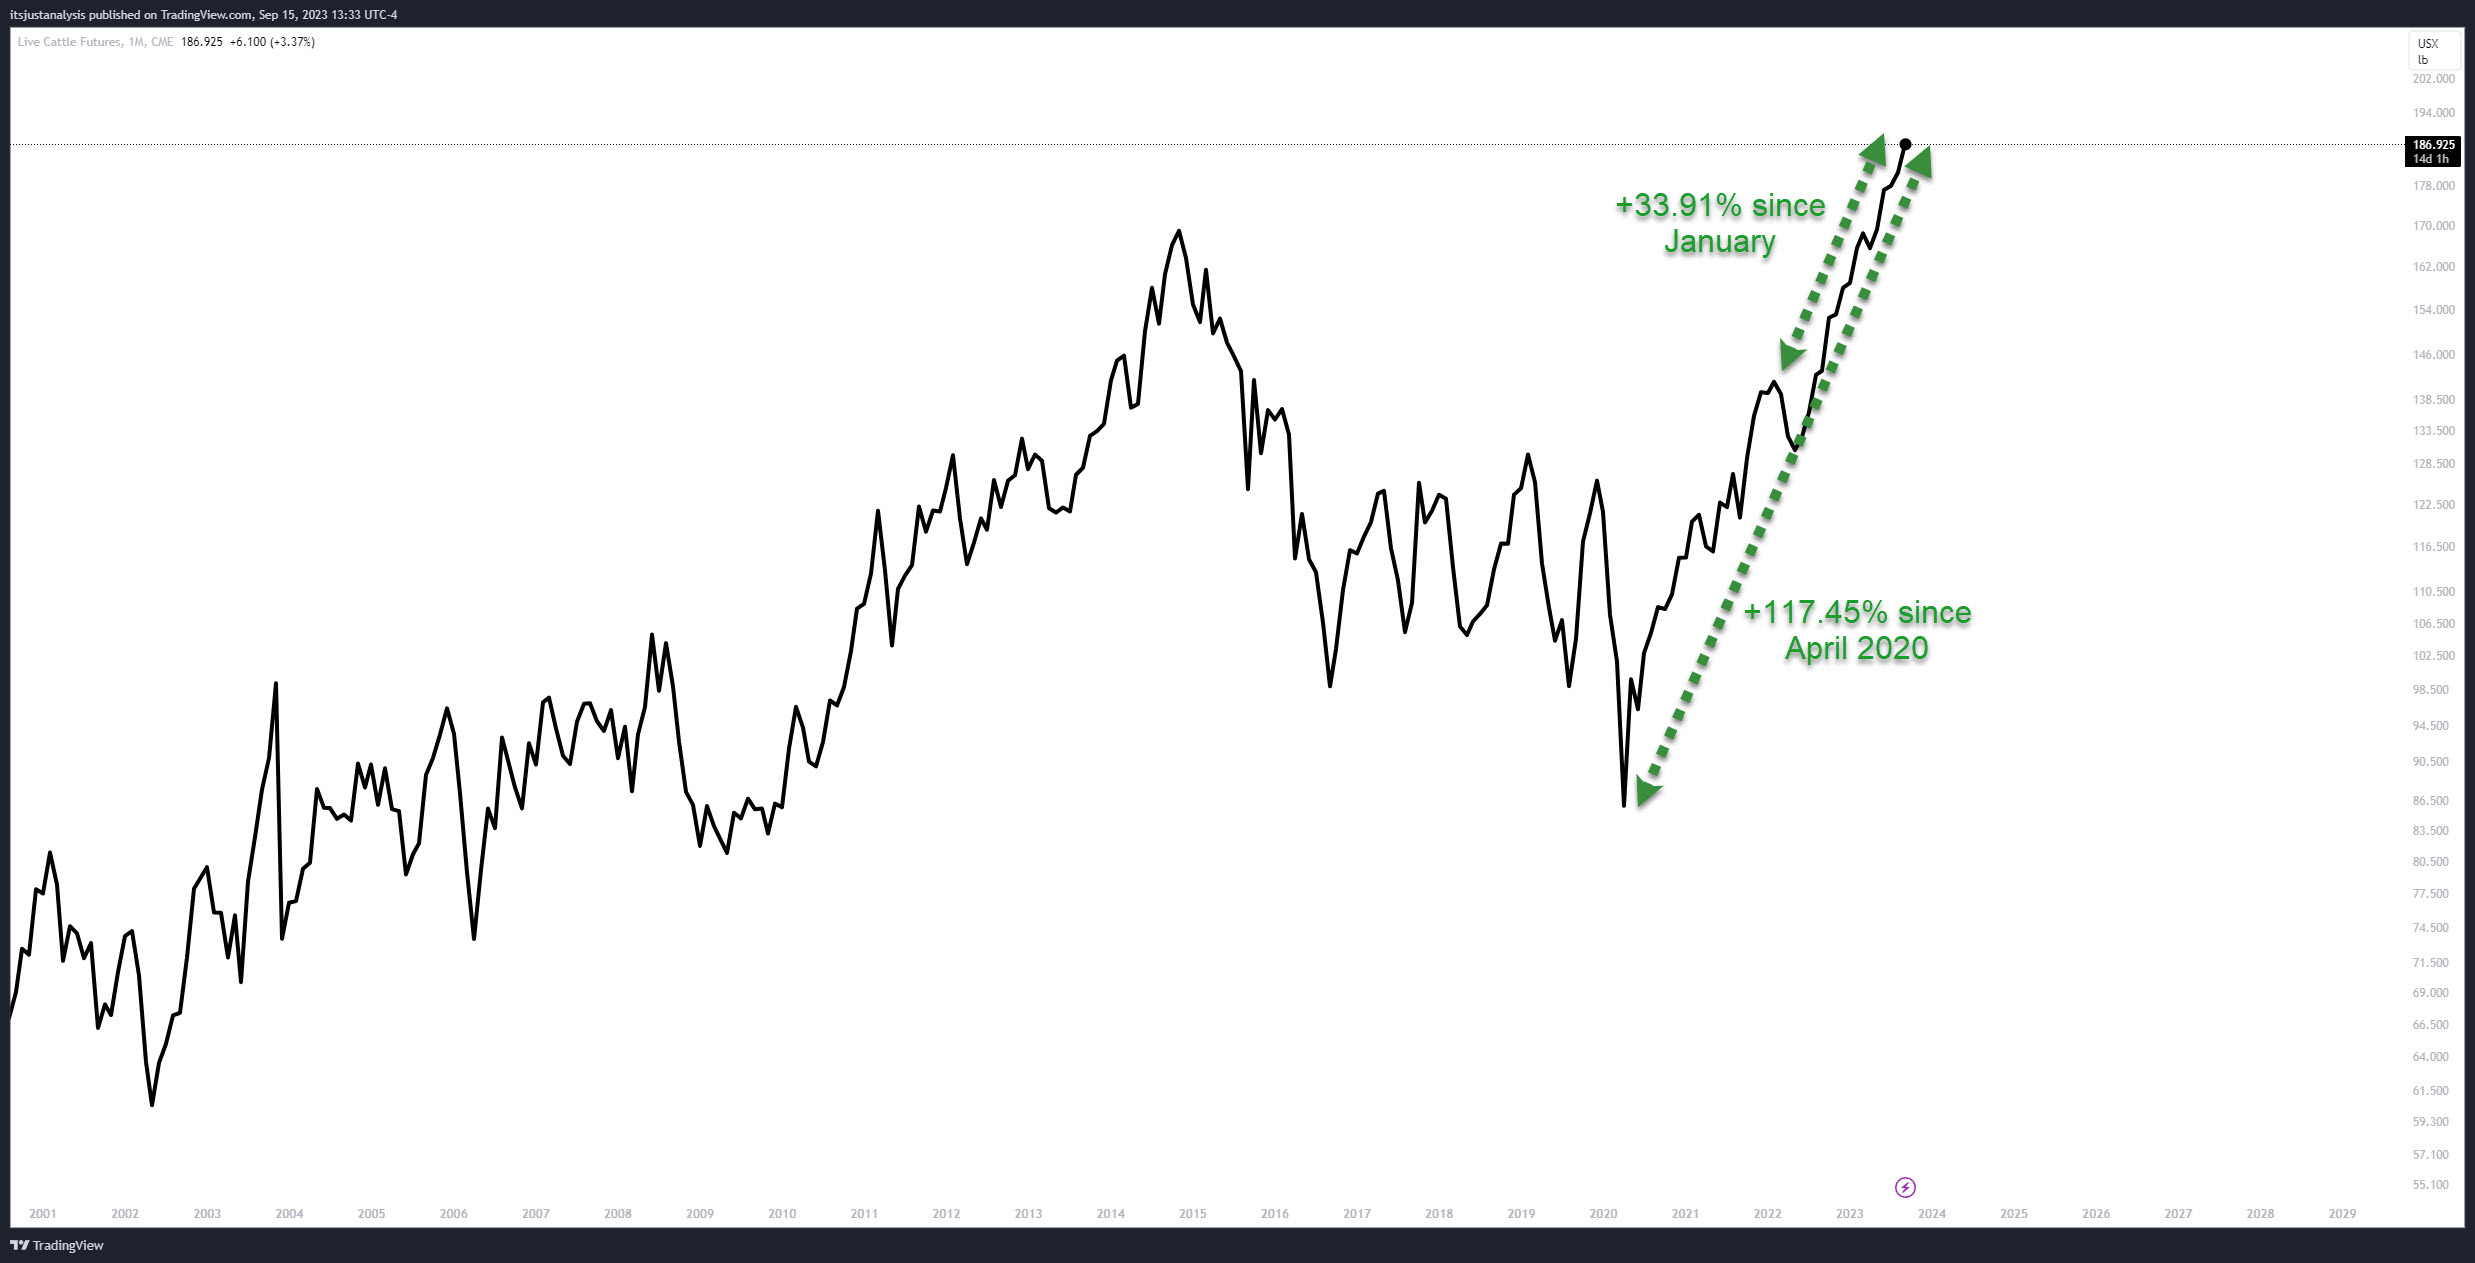
If new all-time highs and a +33.91% gain since January weren’t crazy enough, then about an insane +117.45% gain since the April 2020 lows?

Ribeyes keep getting smaller and more expensive at the same time. 🐮

Gold Futures

Gold Monthly Chart – Click to enlarge.

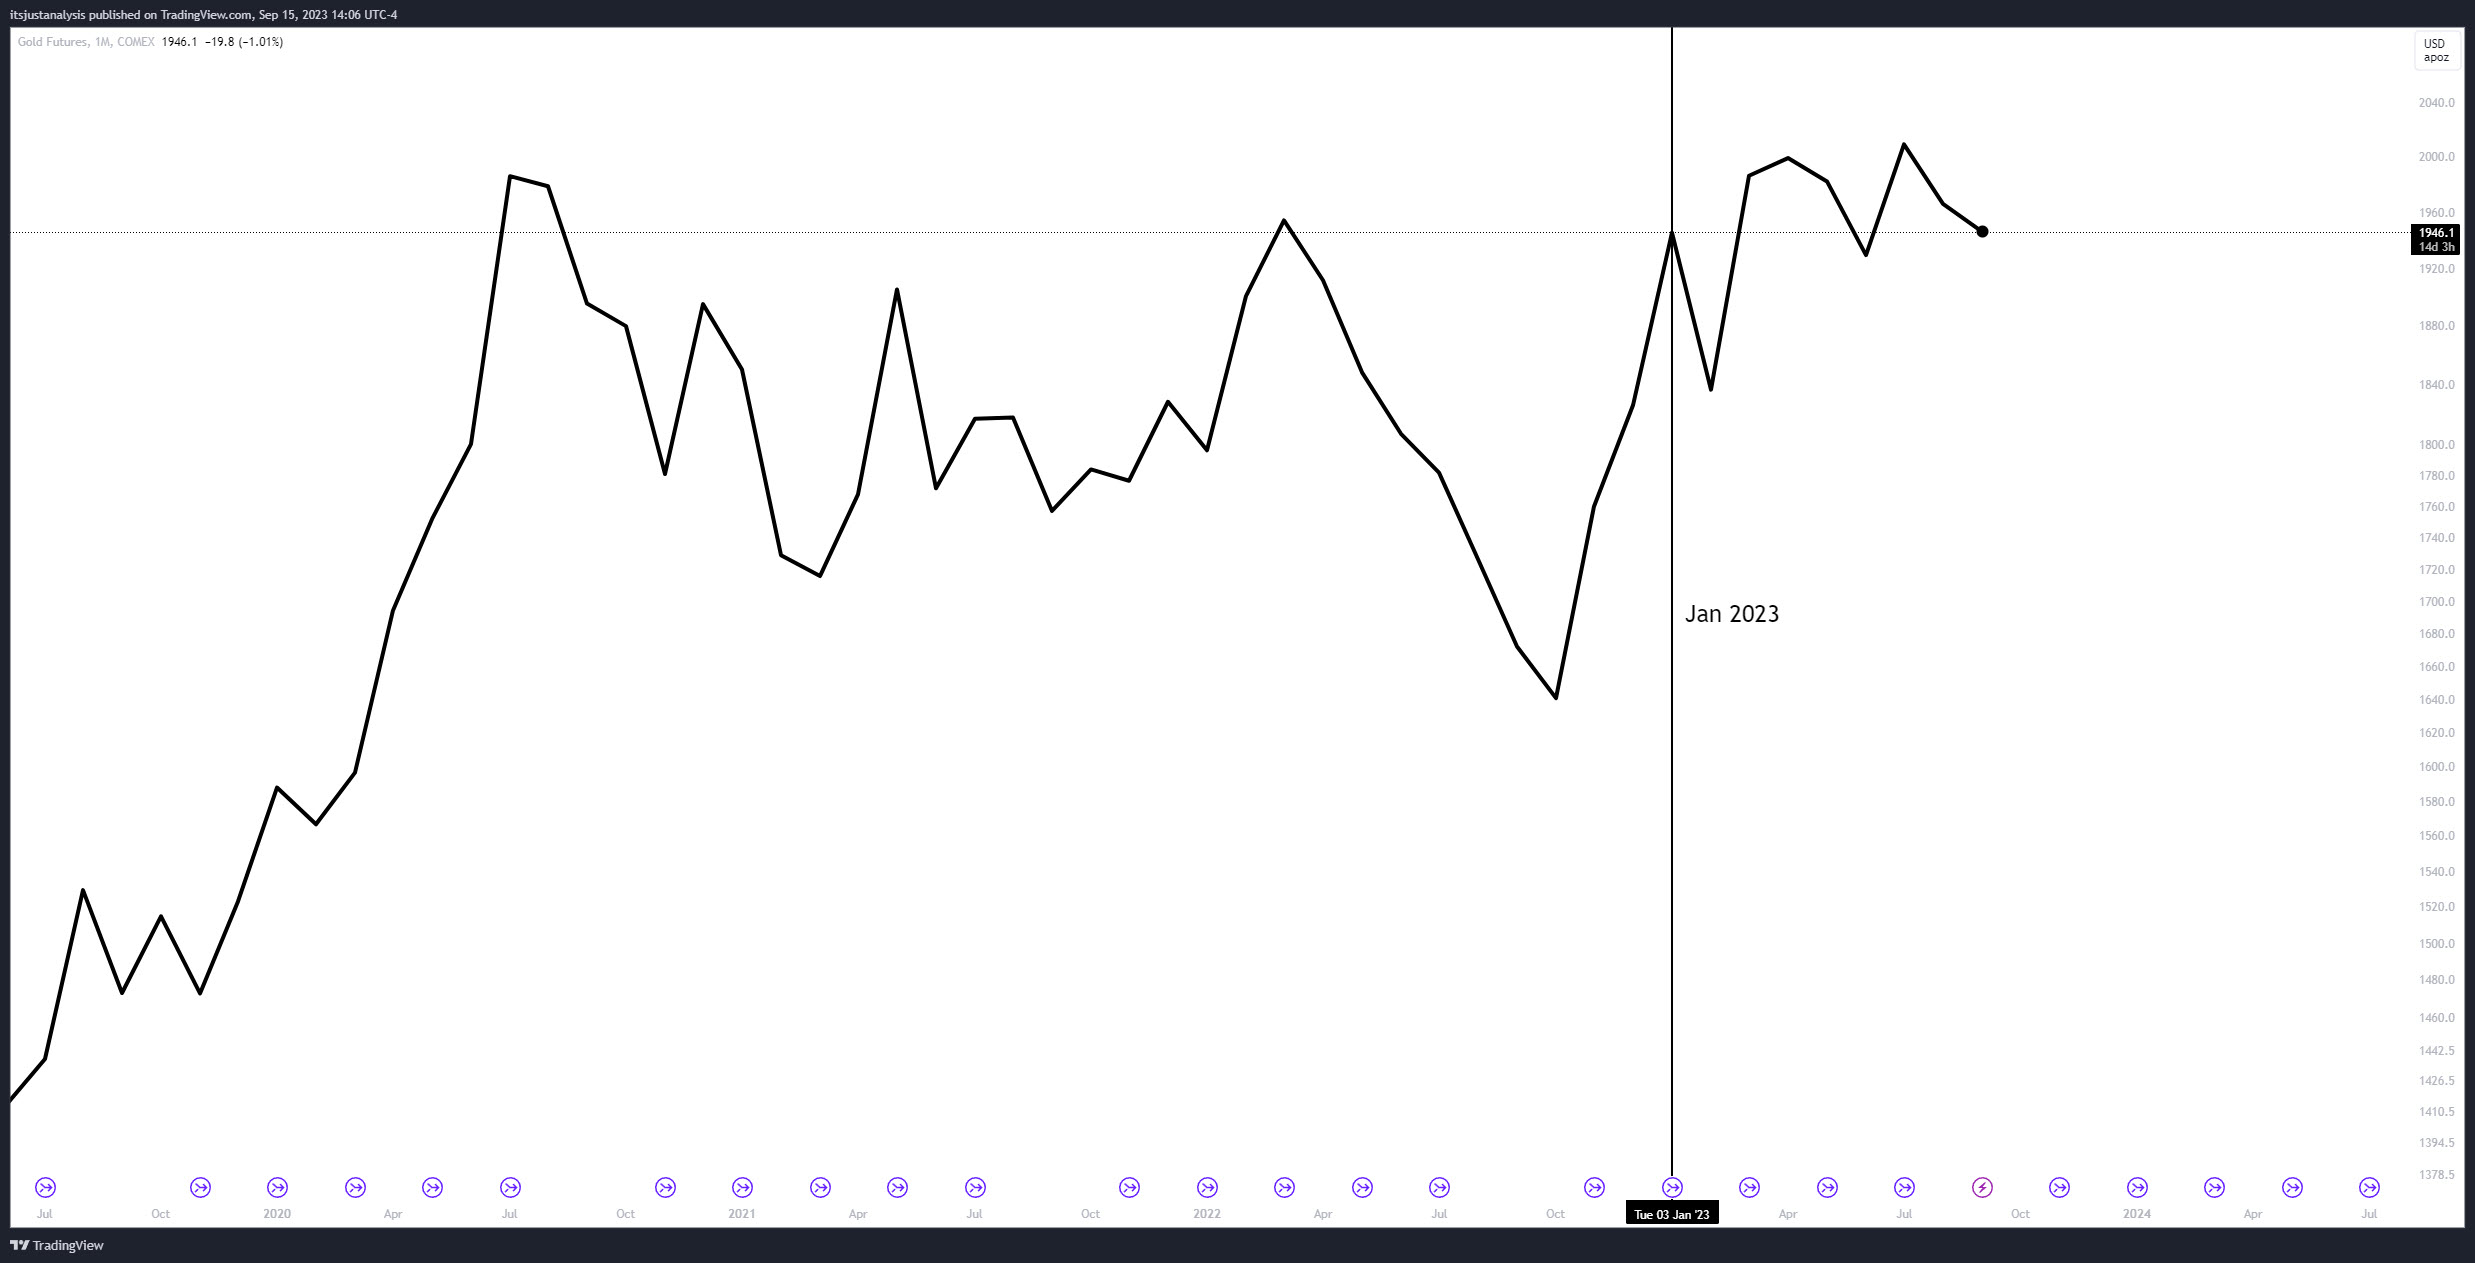
Even though gold isn’t showing off the same YTD gains as the three above commodities, July 2023’s close was the highest monthly close ever. 

And even though gold has moved a little lower, it’s still parked pretty damn close to those highs. 🥇

Oil Returns To The Status Quo

The U.S. oil market is returning to its pre-pandemic norms, at least according to the manager of the popular oil ETF $USO. 🛢️

The United States Oil Fund ($USO) has been around since April 2006 and is a futures-based ETF that looks to track the price of U.S. crude oil. It does so by purchasing the front-month sweet light crude oil (WTI) contract, holding it, and then rolling its holdings to the following contract before expiration. 

Read It

The Base Metal Blues

The world’s eighth-largest aluminum maker, Alcoa, threw investors for a loop on Monday, unexpectedly announcing a new chief executive officer (CEO). 😮

Roy Harvey has led the company since November 2016, when it went public, and will remain a strategic adviser until the end of 2023. He’ll be replaced by William Oplinger, who has served as executive vice president and chief operations officer (COO) since February of this year.

Read It

Natural Gas Is Moving Fast

Okay, maybe not fast. But it certainly is moving differently than it has been. After falling about 80% from its highs from August to March, natural gas futures have been taking the first step to reverse their trend…stop going down. ⏸️

Below is a daily chart of natural gas futures trading in a $2.00 to $2.65 range for the last five months. But this week, traders are putting it back on their radar due to its strength relative to the rest of the energy commodity complex. With crude oil, gasoline, and heating oil all falling several percent this week, natural gas’s nearly 5% gain certainly stands out. 🤔

Read It

Traders Eye Gasoline Prices

Despite being a slow day overall, one chart in the commodities space had traders gassed up. Pun intended. 🙃

That commodity is gasoline, which is heavily tracked due to its impact on consumer confidence and the economy. And most recently, there’s been a significant decline in prices that’s helped cheer people up ahead of the holidays—case in point: the headlines below. 👇

Read It