Last Friday’s Litepaper highlighted an important time-based element on Bitcoin’s ($BTC.X) daily chart within the Ichimoku Kinko Hyo system known as a Kumo Twist. Kumo Twists occur when Senkou Span A (green line of the Cloud) crosses Senkou Span B (red line of the Cloud).
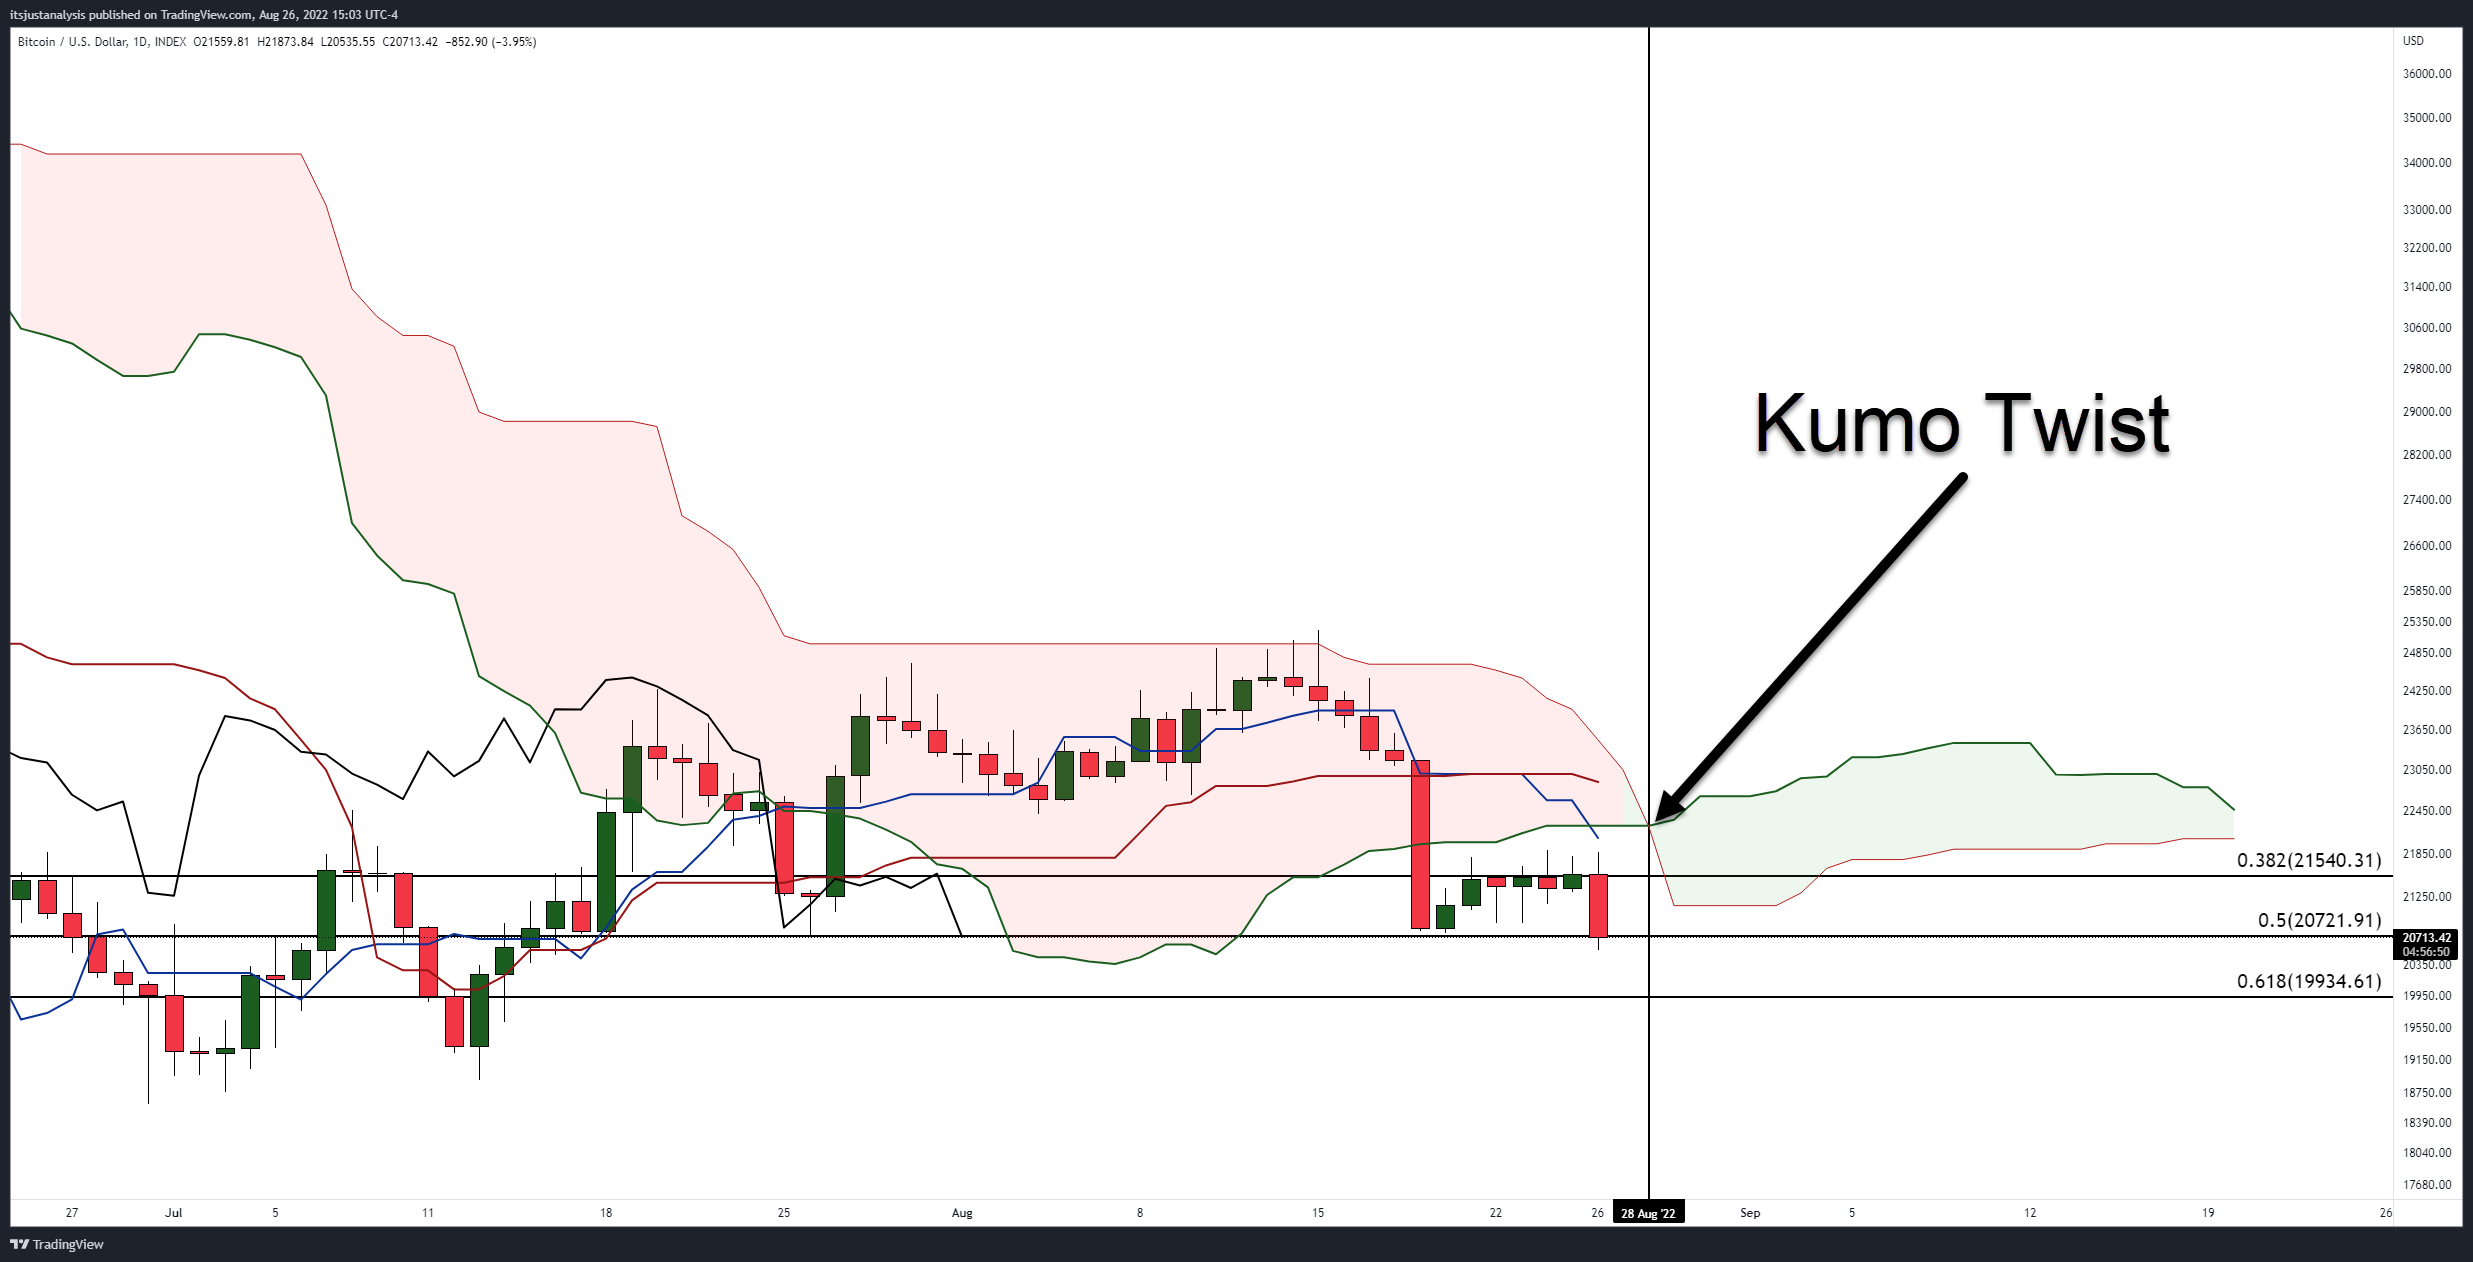
Kumo Twists can be important ‘heads-up’ warnings to traders and investors. When an instrument moves in a single direction into a Kumo Twist, there is a high probability of price action reversing into a brand new trend or a strong corrective move.
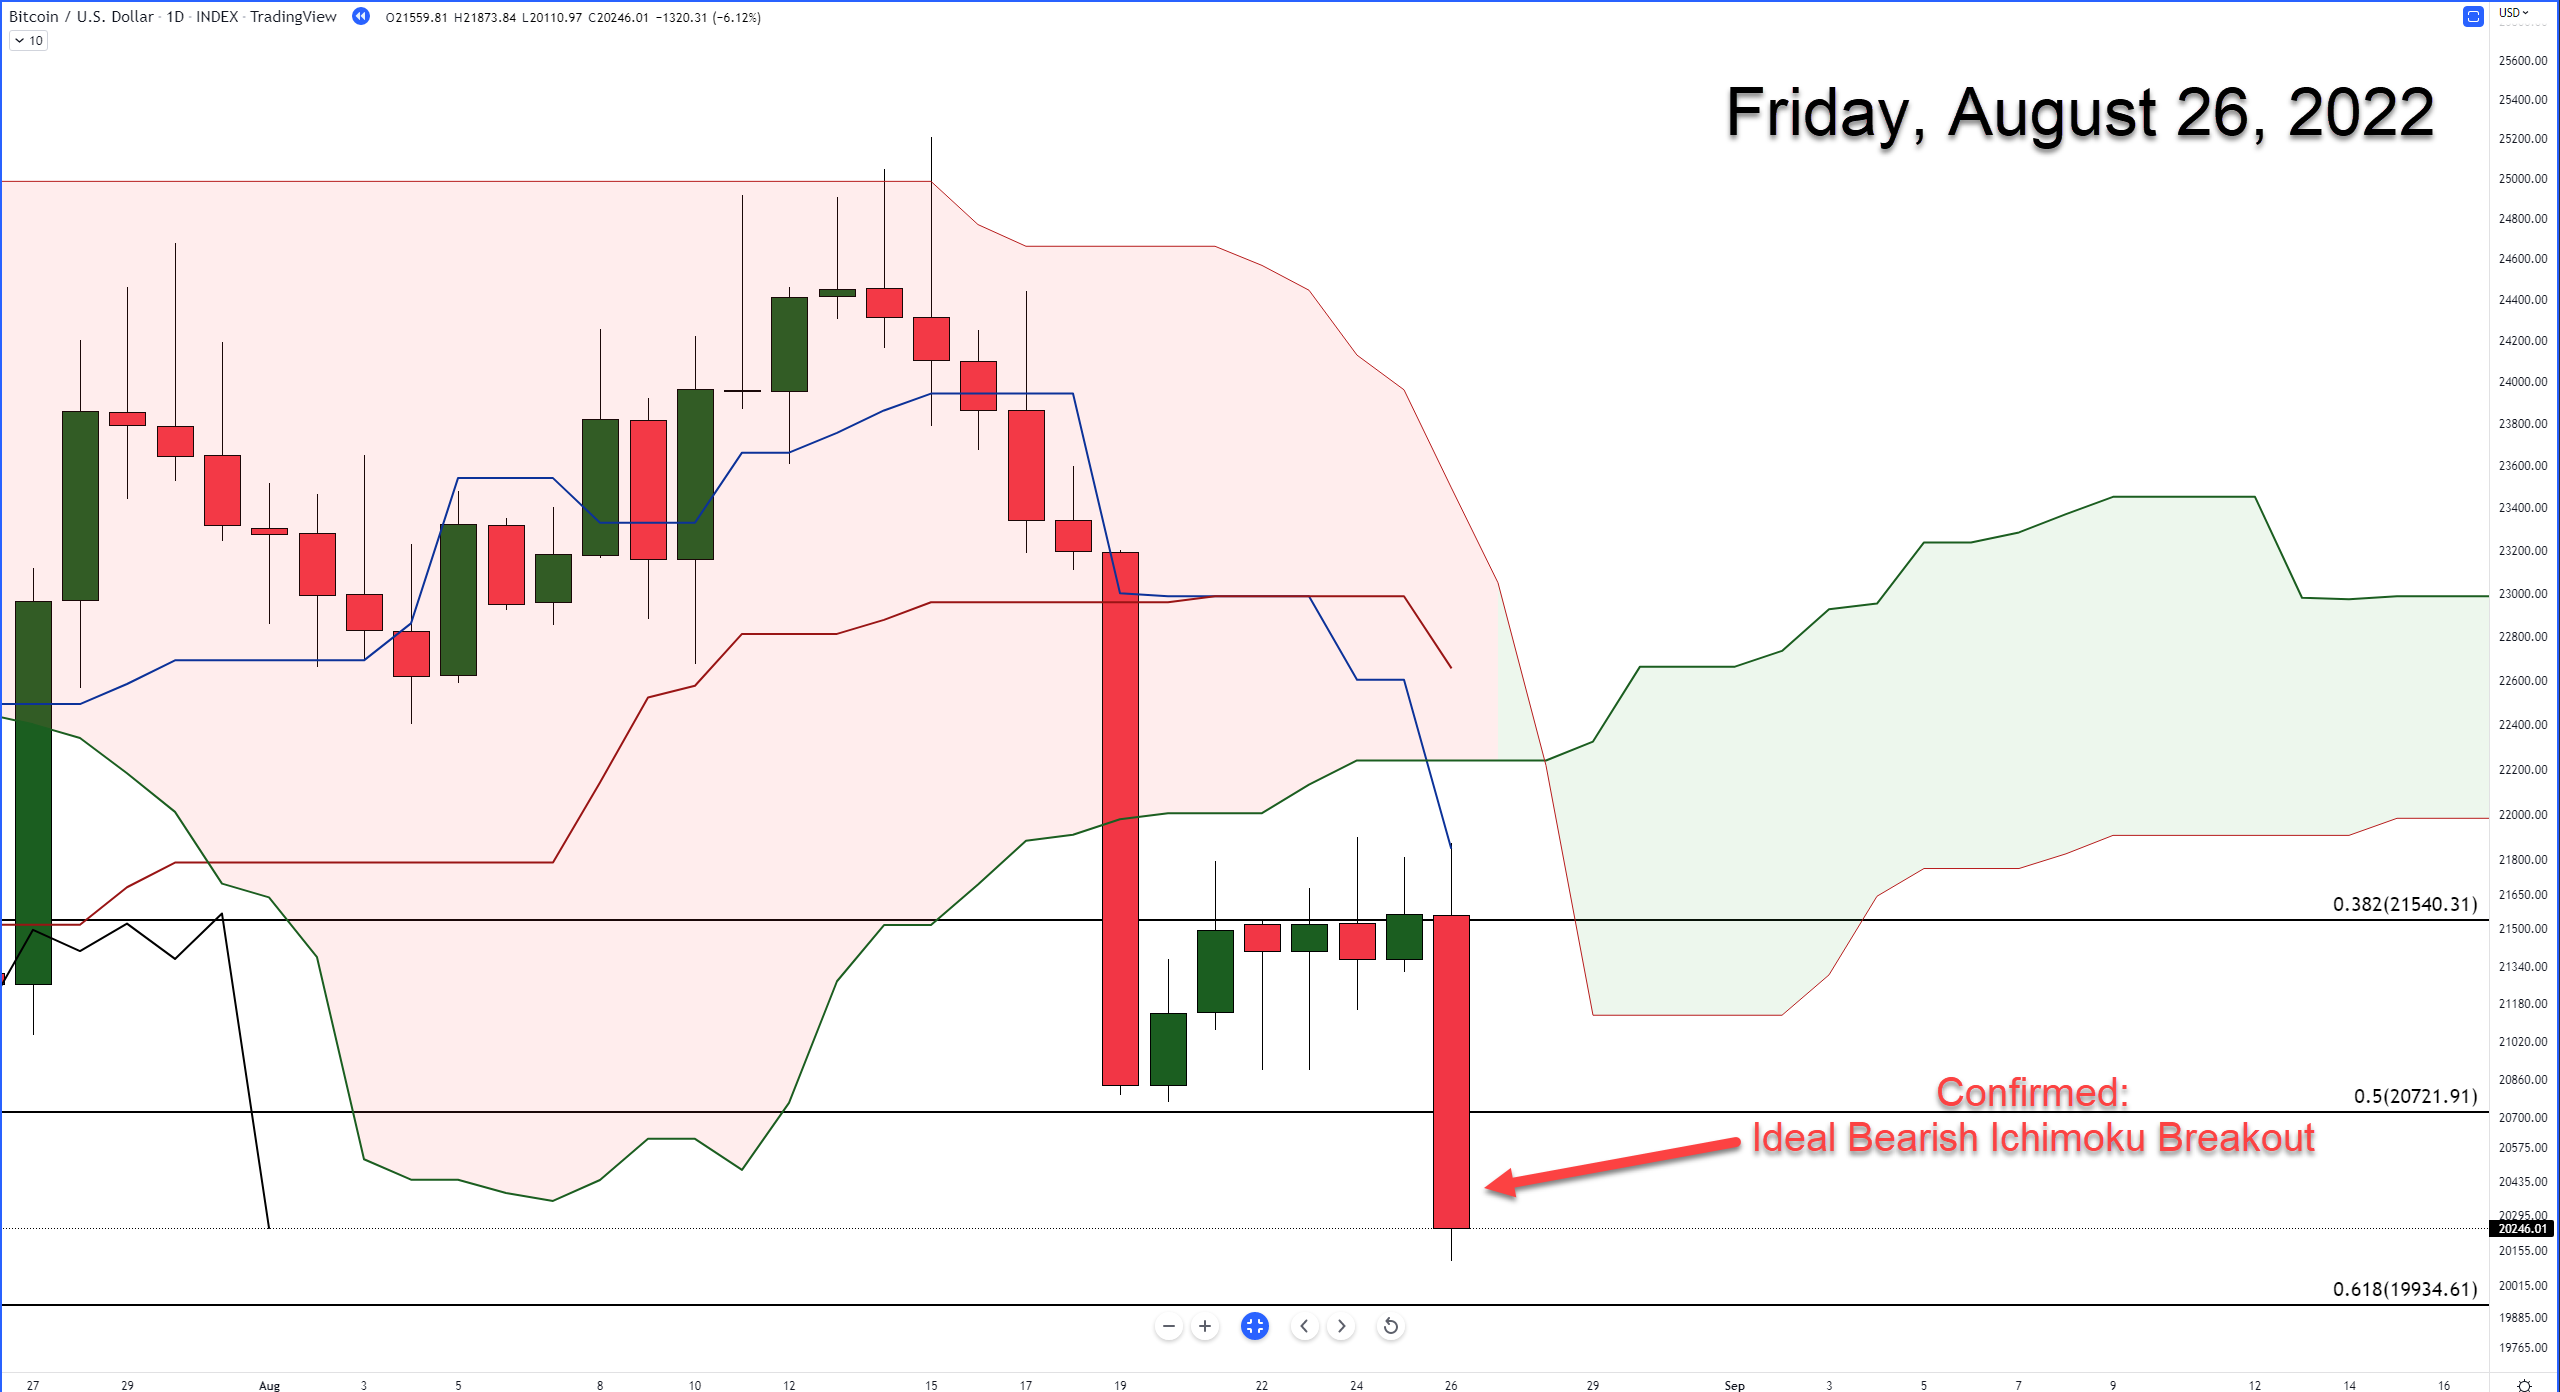
Since last Friday, Bitcoin has continued moving lower. Friday’s close confirmed one of the strongest bearish setups within the Ichimoku system: the Ideal Bearish Ichimoku Breakout, which positions Bitcoin for a strong and highly probable move lower.
Further exacerbating the bearishness of Bitcoin’s current position within the Ichimoku system is where Bitcoin closed on Sunday: below the critical 61.8% Fibonacci retracement level of $19,934 – the final primary price support level.
The result of such a strong collection of bearish signals points to a high likelihood of Bitcoin not only matching current 2022 lows but pushing towards new 2022 lows discussed in the August 22, 2022 Litepaper ($13,500 – $16,000).
However, today’s price action shows a bit of a bounce for Bitcoin and the broader cryptocurrency market. When writing this Litepaper, Bitcoin has regained the critical $20,000 level and is trading around $20,250.
So what is contributing to this bounce? From a technical analysis perspective, the Composite Index oscillator gives a good reason.
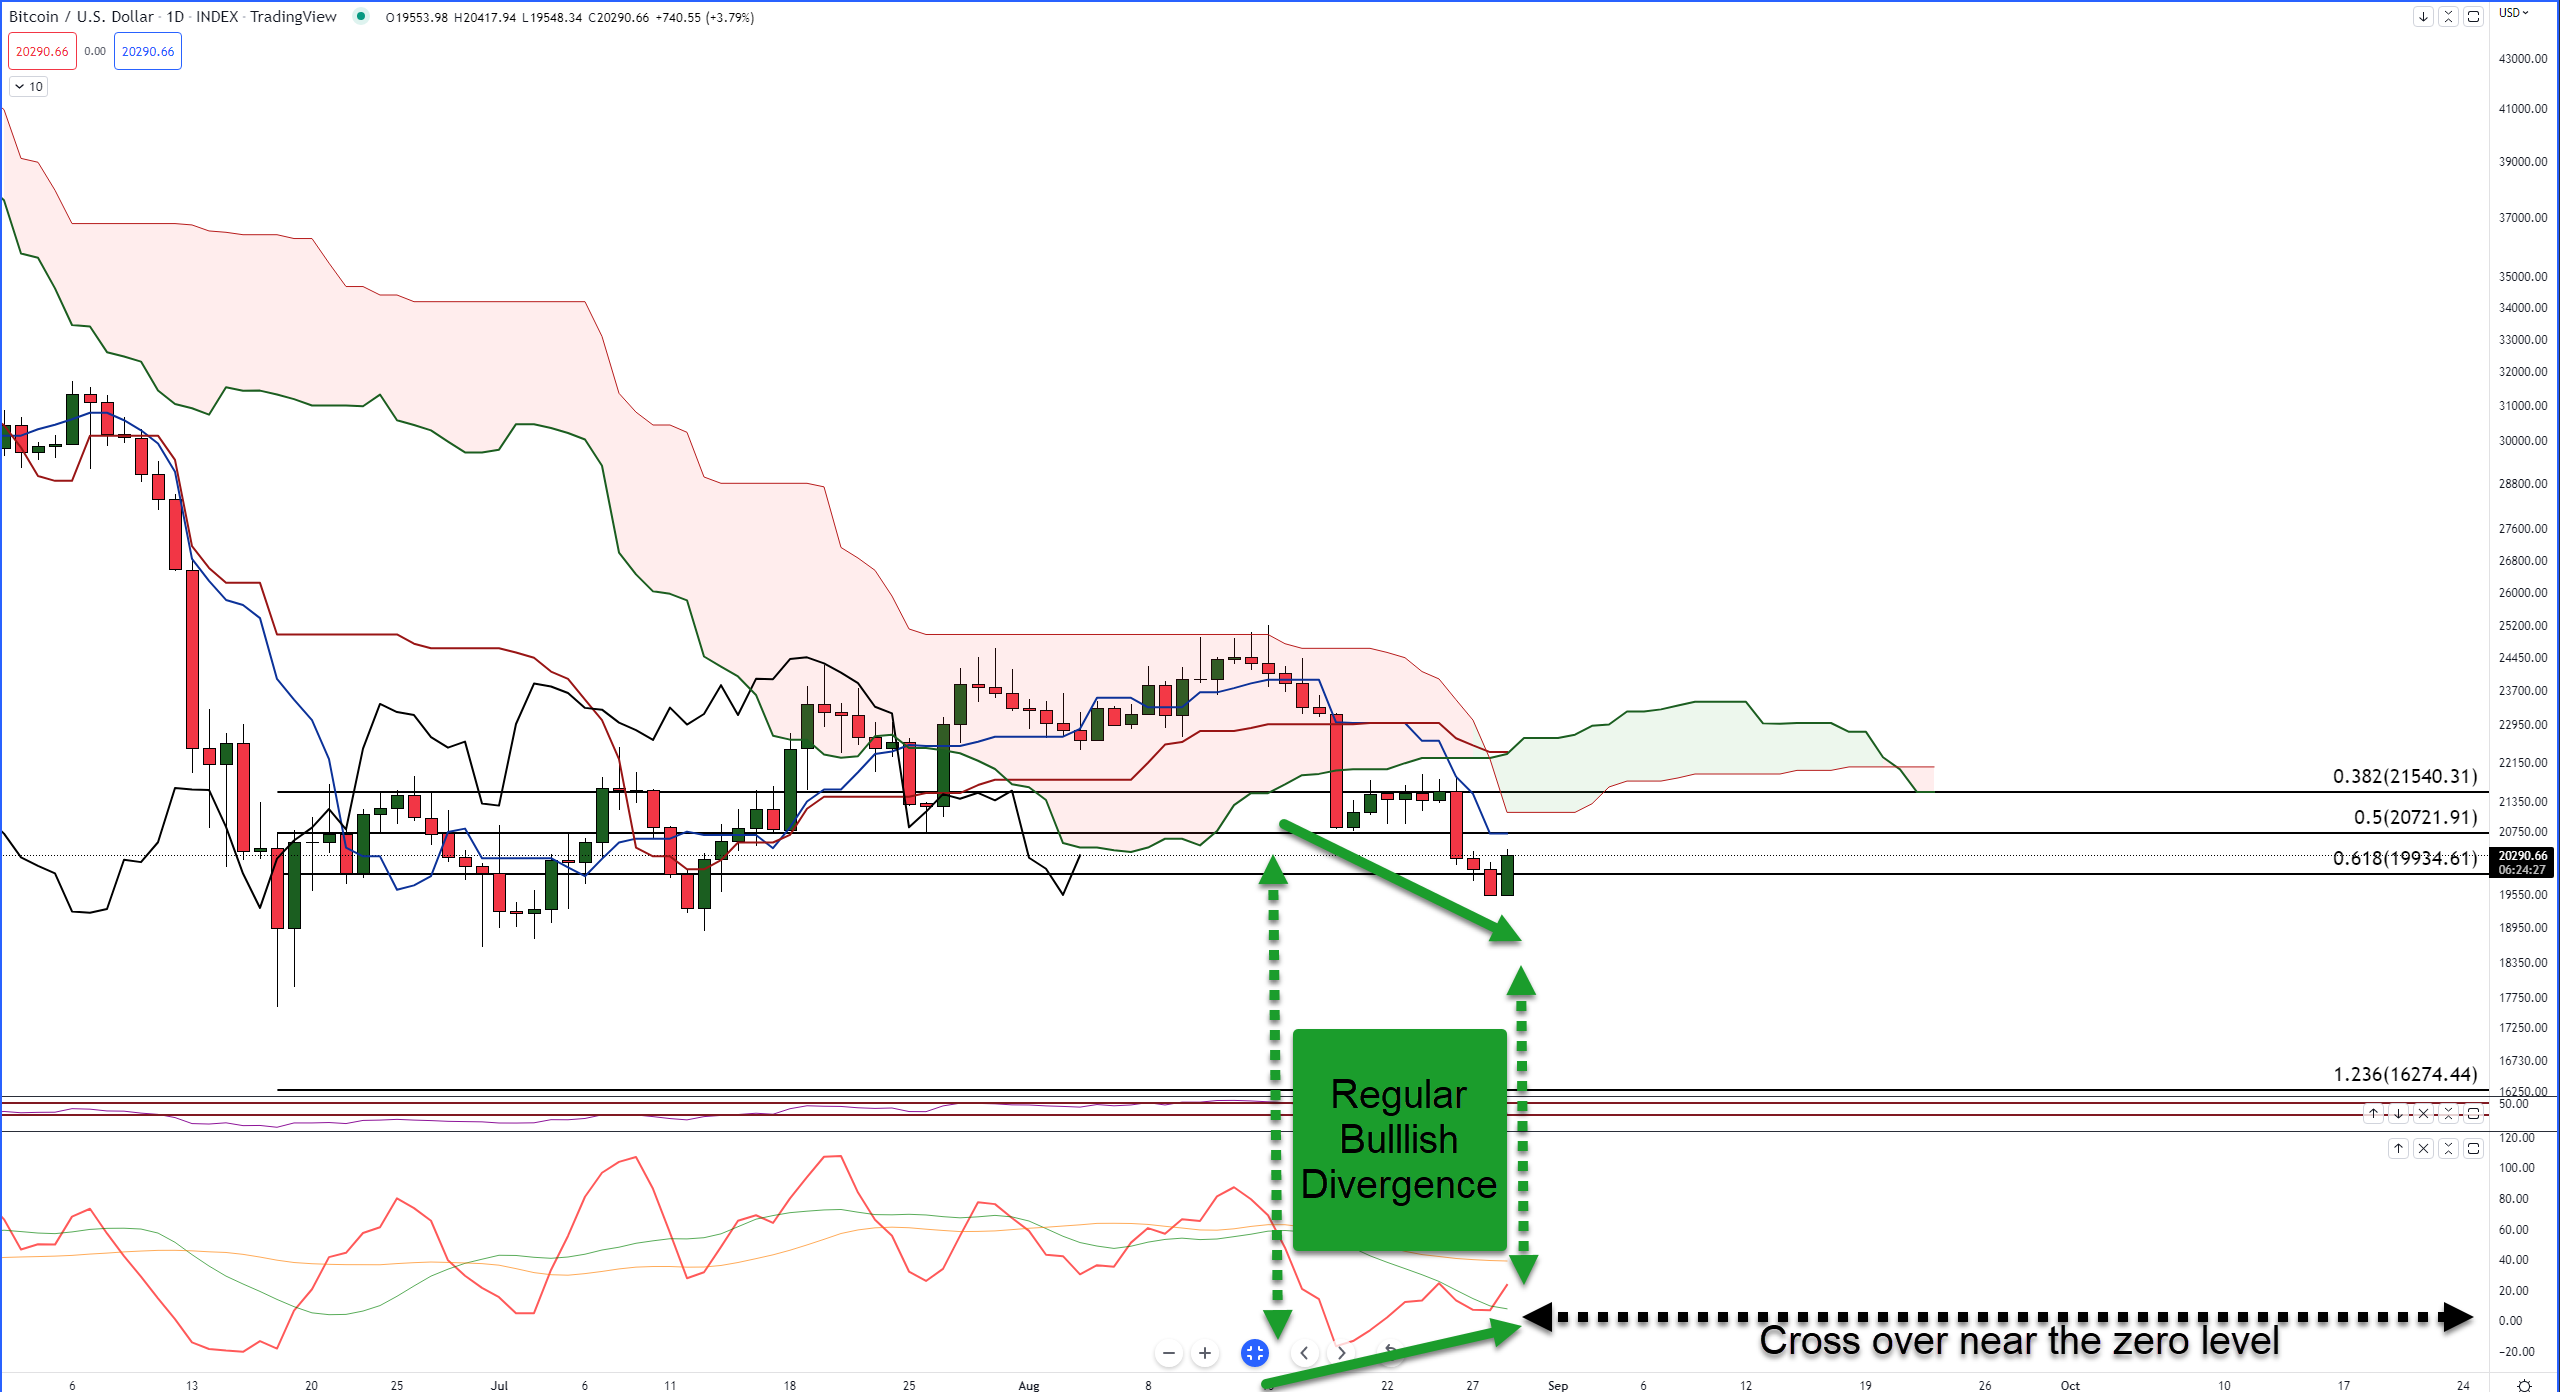
Observe the green arrows on the chart above. Price has made lower lows, while the oscillator has made lower lows. This is known as Hidden Bullish Divergence – a warning sign that the current downtrend may reverse.
However, more important than the hidden bullish divergence is the crossover of the Composite Index Line (red) above its fast-moving average (green). The crossover occurred almost right on top of the zero level of the oscillator. Why is this important?
Connie Brown, the inventor and creator of the Composite Index, wrote about the type of crossover we’re observing. In her book, Technical Analysis for the Trading Professional, Brown wrote, “The strongest signals are often those more subtle and closer to the zero line or under two averages crossing on the oscillator.”
Does this mean an epic, massive bull run is about to begin?! No.
Follow-through is necessary.
Like the combination of the Ideal Bearish Ichimoku Breakout confirmation and the close below the 61.8% Fibonacci retracement, nothing is guaranteed, even though the signal may be strong.
Bears and bulls will want to watch for a retracement that first tests the primary near-term resistance for Bitcoin: a confluence zone of the daily Tenkan-Sen and 50% Fibonacci retracement at $20,722. Above that is the next resistance zone between Senkou Span B ($21,200) and the 50% Fibonacci retracement ($21,500).
Any successful daily close above one or both of those resistance zones could spell a bearish fakeout and trigger a strong bull run. Conversely, any rejection on the daily chart, especially against $20,722, may confirm another leg south.
Like every other market, Cryptocurrencies experience choppy trading and price action a week before the Labor Day holiday – so watch the market closely!
We’ll update you as price action develops. 🔭