Last Wednesday (August 31, 2022), the Litepaper focused on a possible short squeeze occurring for Bitcoin. The image below is the weekly Composite Index of the BTCUSDT Shorts chart from August 31.
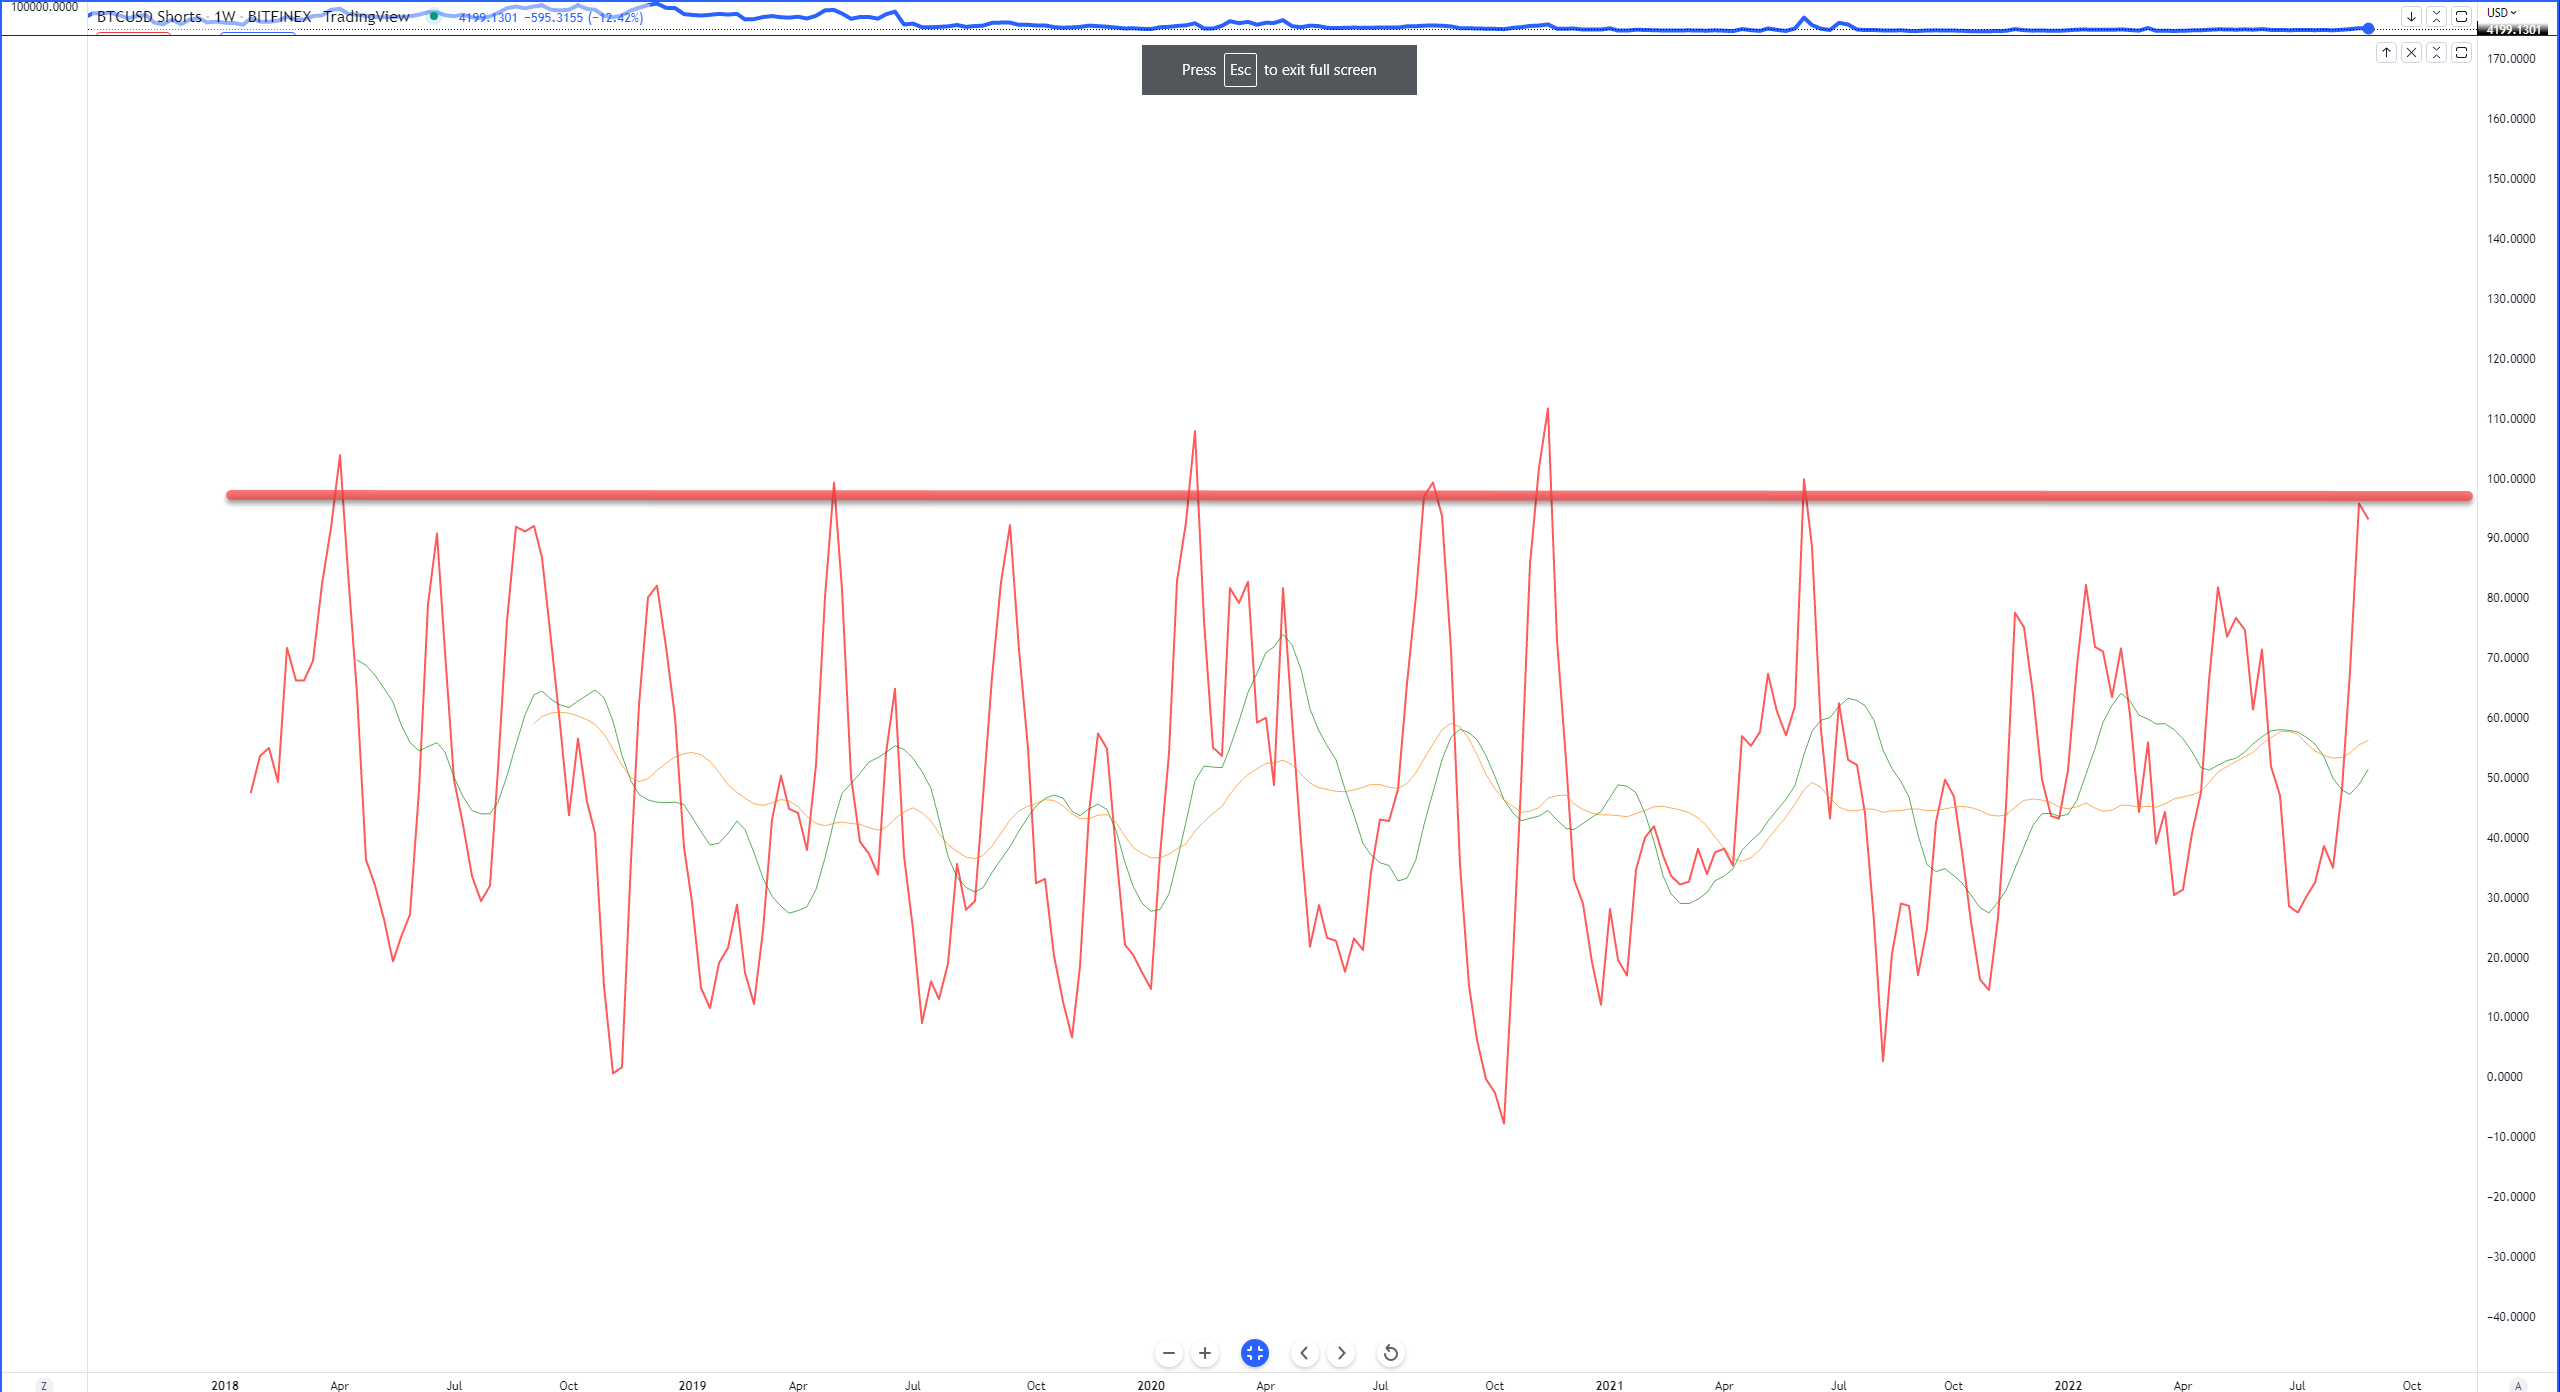
One of the closing points made in the August 31, 2022 Litepaper was, “Historically, massive gaps between the Composite Index’s line and its moving averages don’t last long.”
Note how much the Composite Index has moved in the past 9 days:
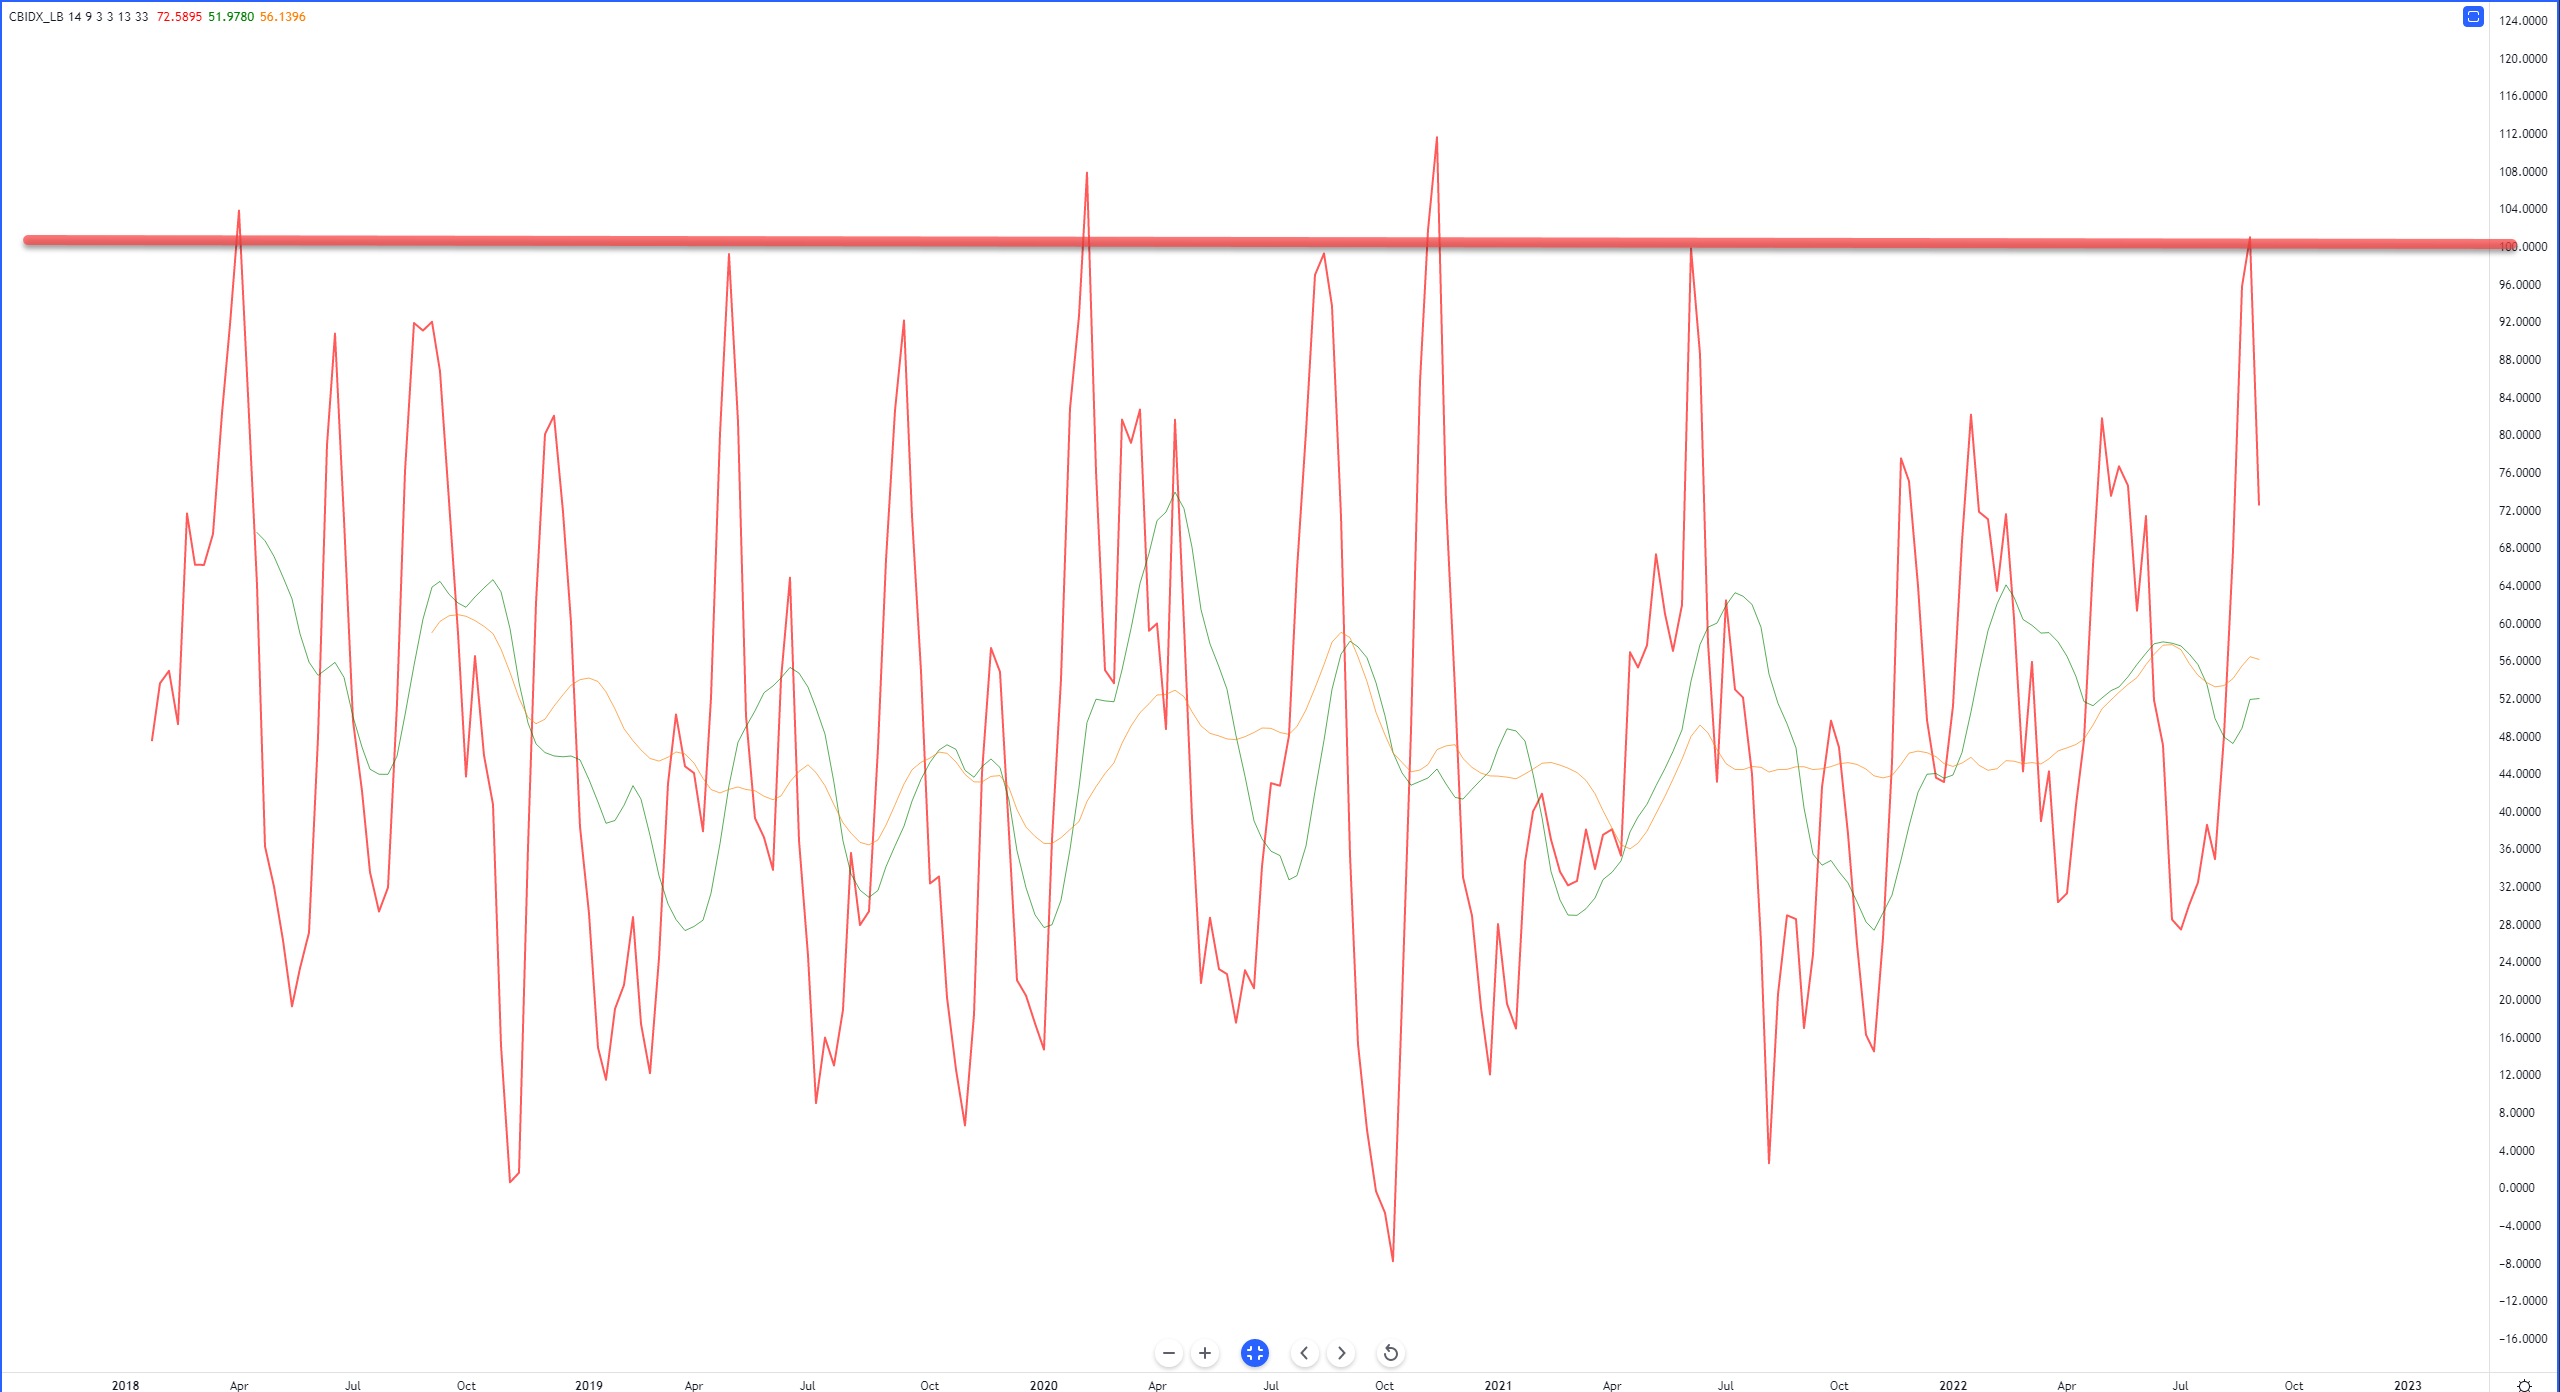
There was clear rejection against the red horizontal line that demarcates where many of the major peaks exist on the weekly chart.
So does this mean a turnaround is going to happen soon? Is the cryptocurrency market poised for a massive rally? Is the doom and gloom over? Maybe – but a few things have to happen before the bulls can take over.
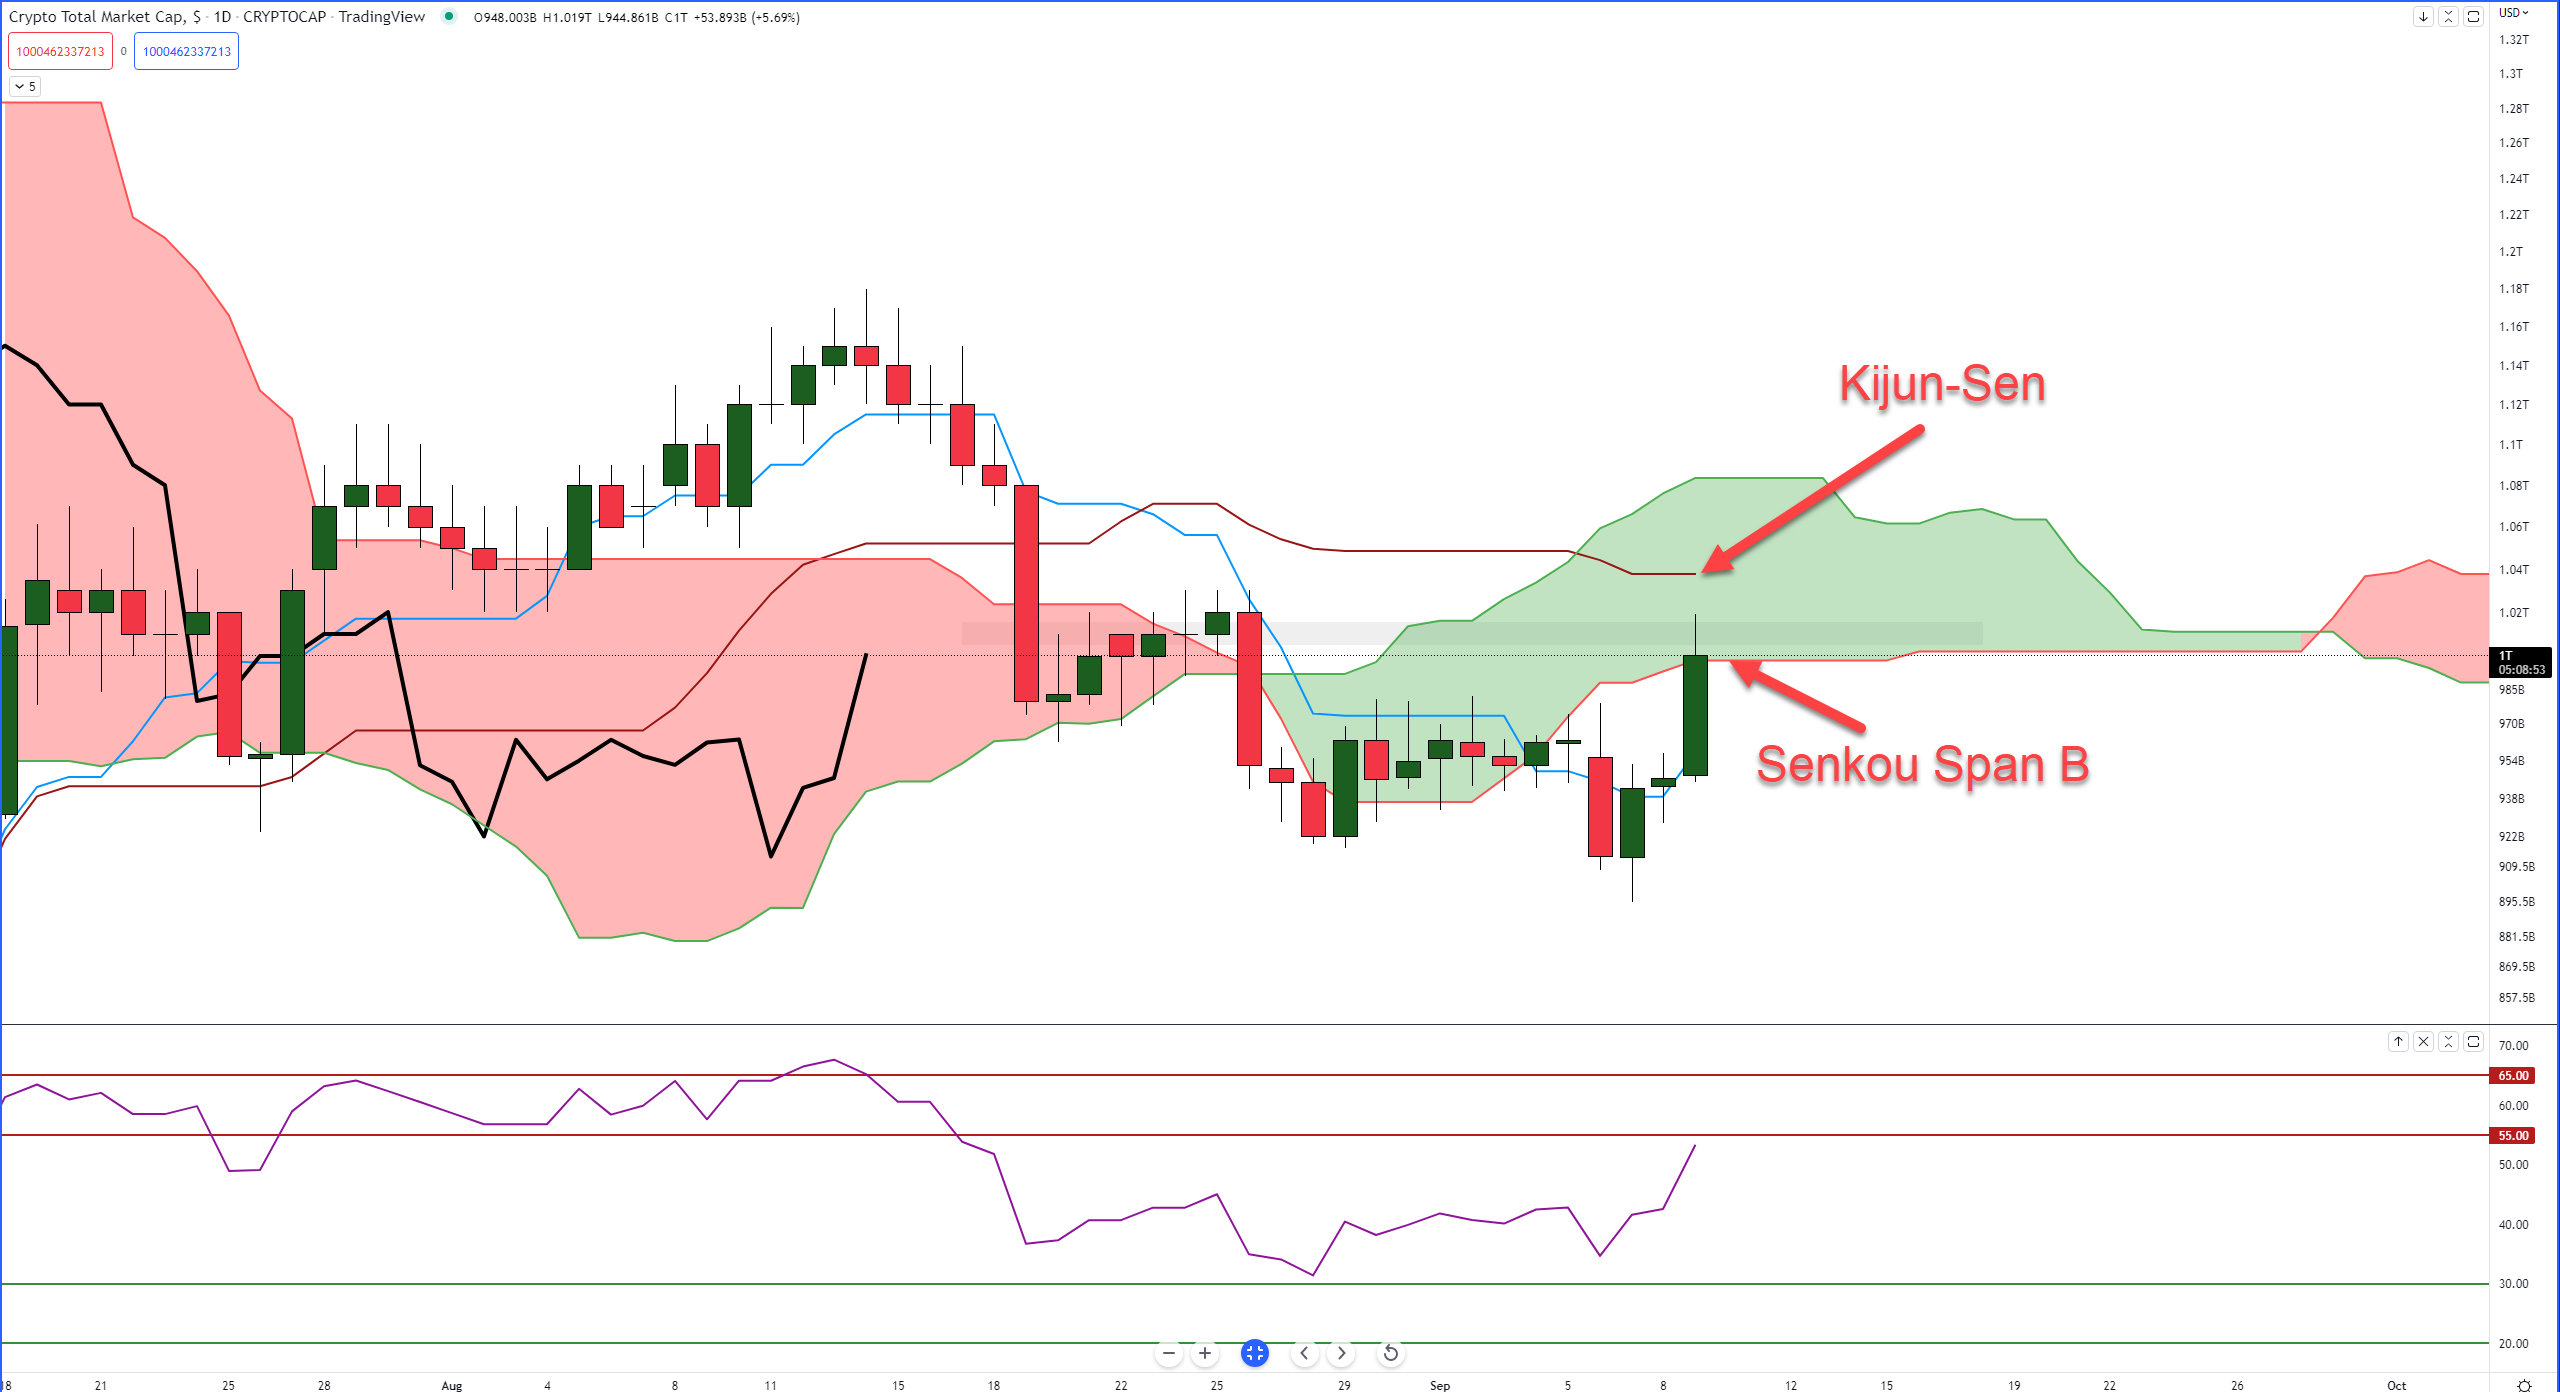
The image above shows the weekly chart of the Total Crypto Market Cap with the Ichimoku Kinko Hyo System (Read the Introduction to Ichimoku here). The most powerful support/resistance level within the Ichimoku system is Senkou Span B – which is exactly where the current price level is fighting against.
The daily candlestick is just above Senkou Span B ($999 Billion) and inside the Cloud. Which, if you’ve read our introduction to Ichimoku, is a horrible, horrible place. Above Senkou Span B is the Kijun-Sen, another strong resistance level ($1.04 Trillion).
The bearish energy here isn’t done – note the Relative Strength (RSI) Index below the candlestick chart. The RSI is set up for bear market conditions, so the overbought levels are 55 and 65. The RSI is parked right up against that first overbought level at 55.
So how is this interpreted?
For bears, it looks pretty good. For bulls, it’s a little nerve-wracking. The combination of the RSI up against 55 while price shows difficulty crossing Senkou Span B is a major boon for bears.
Psychologically, the massive intraday gains have given crypto traders/investors a sense of relief, but imagine how demoralizing that would be if the market clawed back 50% of today’s gains and positioned the daily close below Senkou Span B? Short sellers would like that a bunch.
For bulls, the path to a clear and sustained bull run requires more waiting. Sorry, that’s the name of the game in any market and it’s the hardest thing to do: wait. Bulls really need to wait for an Ideal Bullish Ichimoku Breakout setup.
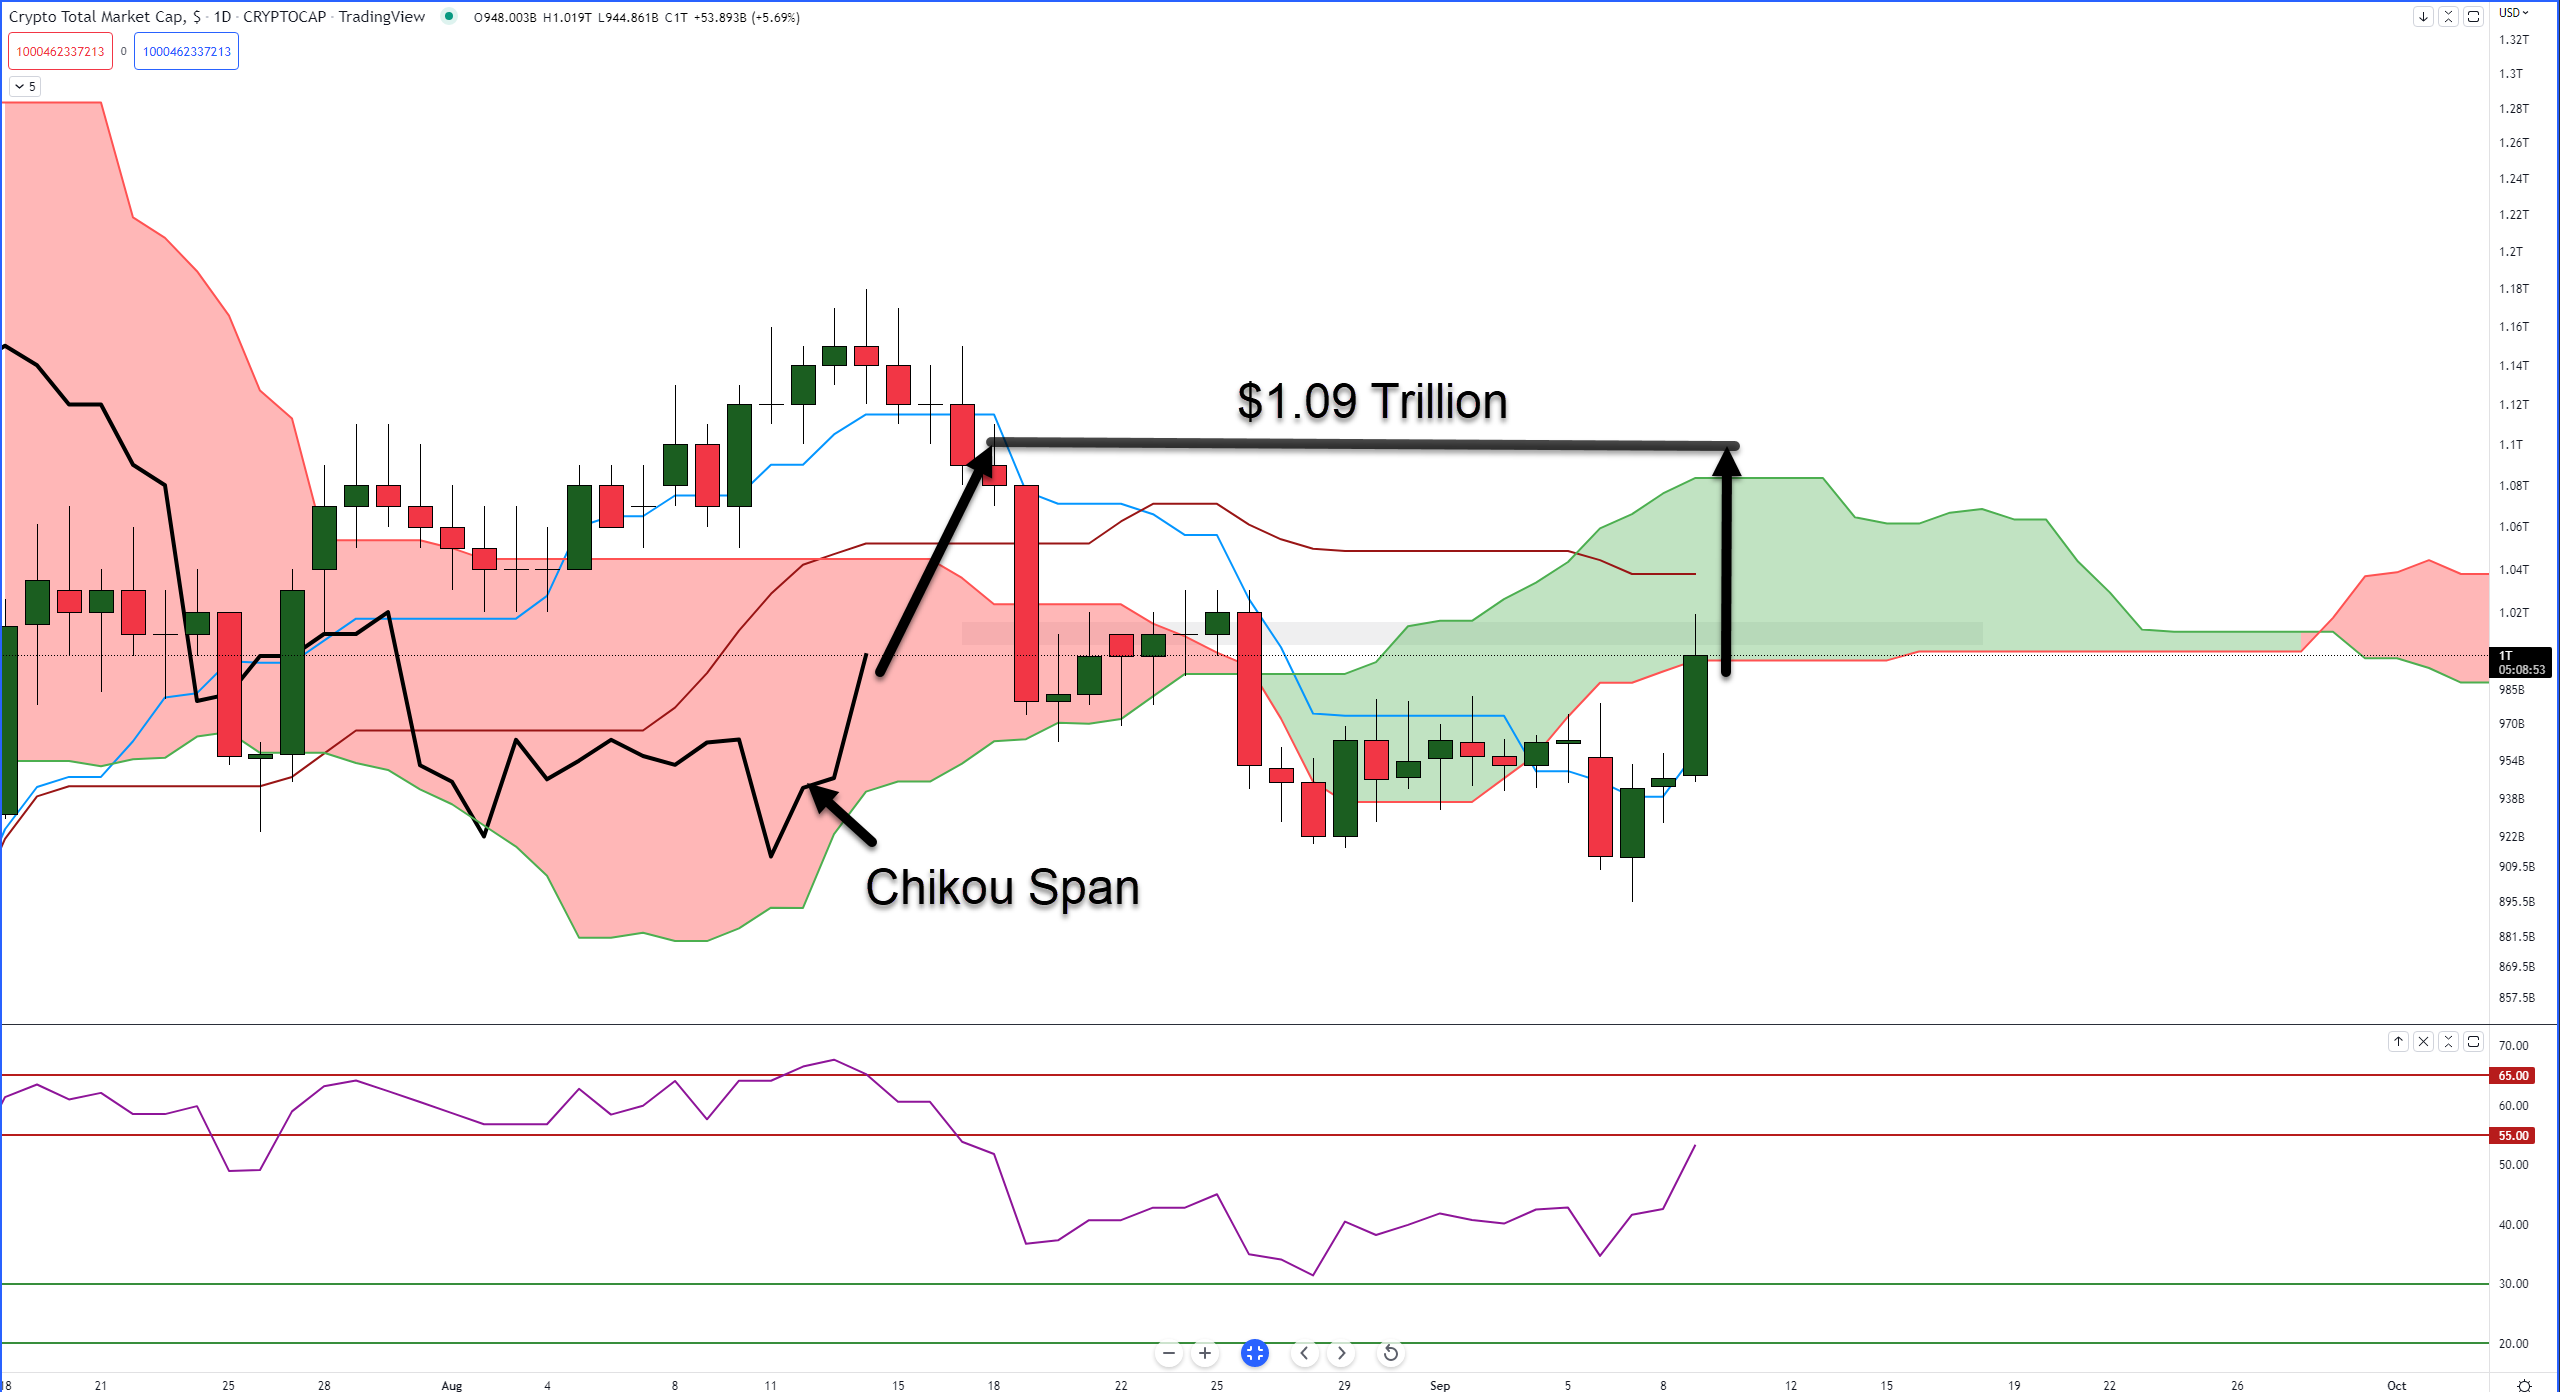
Without going into the entirety of the Ideal Bullish Ichimoku Breakout, the two primary things that need to happen on the daily chart are a close above the Cloud and the Chikou Span above the bodies of the candlesticks.
For those two conditions to be true, today’s market cap needs to return to $1.15 trillion. That might prove difficult given there’s a weekend coming up, but the threshold drops from $1.15 Trillion to $1.09 Trillion by next Tuesday.
We’ll keep you updated as this market continues to progress. 📈