We’re going to revisit two of our previous Technically Speaking articles and evaluate how they’ve performed since their date of publishing. Call me a big nerd, but it’s fun to track the market’s progression and how it does or doesn’t follow the technical analysis theories applied.
The especially interesting aspects are the theories underpinning technical analysis—some of which have their roots more than a century ago—were conceived long before cryptocurrencies even made their debut on a candlestick chart. This offers us an extraordinary opportunity to transpose these time-tested theories onto a new market and to observe first-hand how they function and manifest. This is precisely what we will be doing in our discussion today.
Also – if you’d like to know more about the Ichimoku System, check out our Intro to Ichimoku here.
XRP
The first chart we will look at is $XRP‘s weekly chart from the February 17, 2023, Technically Speaking article about a pattern in Gann Analysis known as a Foldback.

The Foldback Theory tells us that we should expect to see the same swing structure repeat in the future.
Fast forward to the current weekly chart, and it looks like XRP continues to follow the prior swing structure.
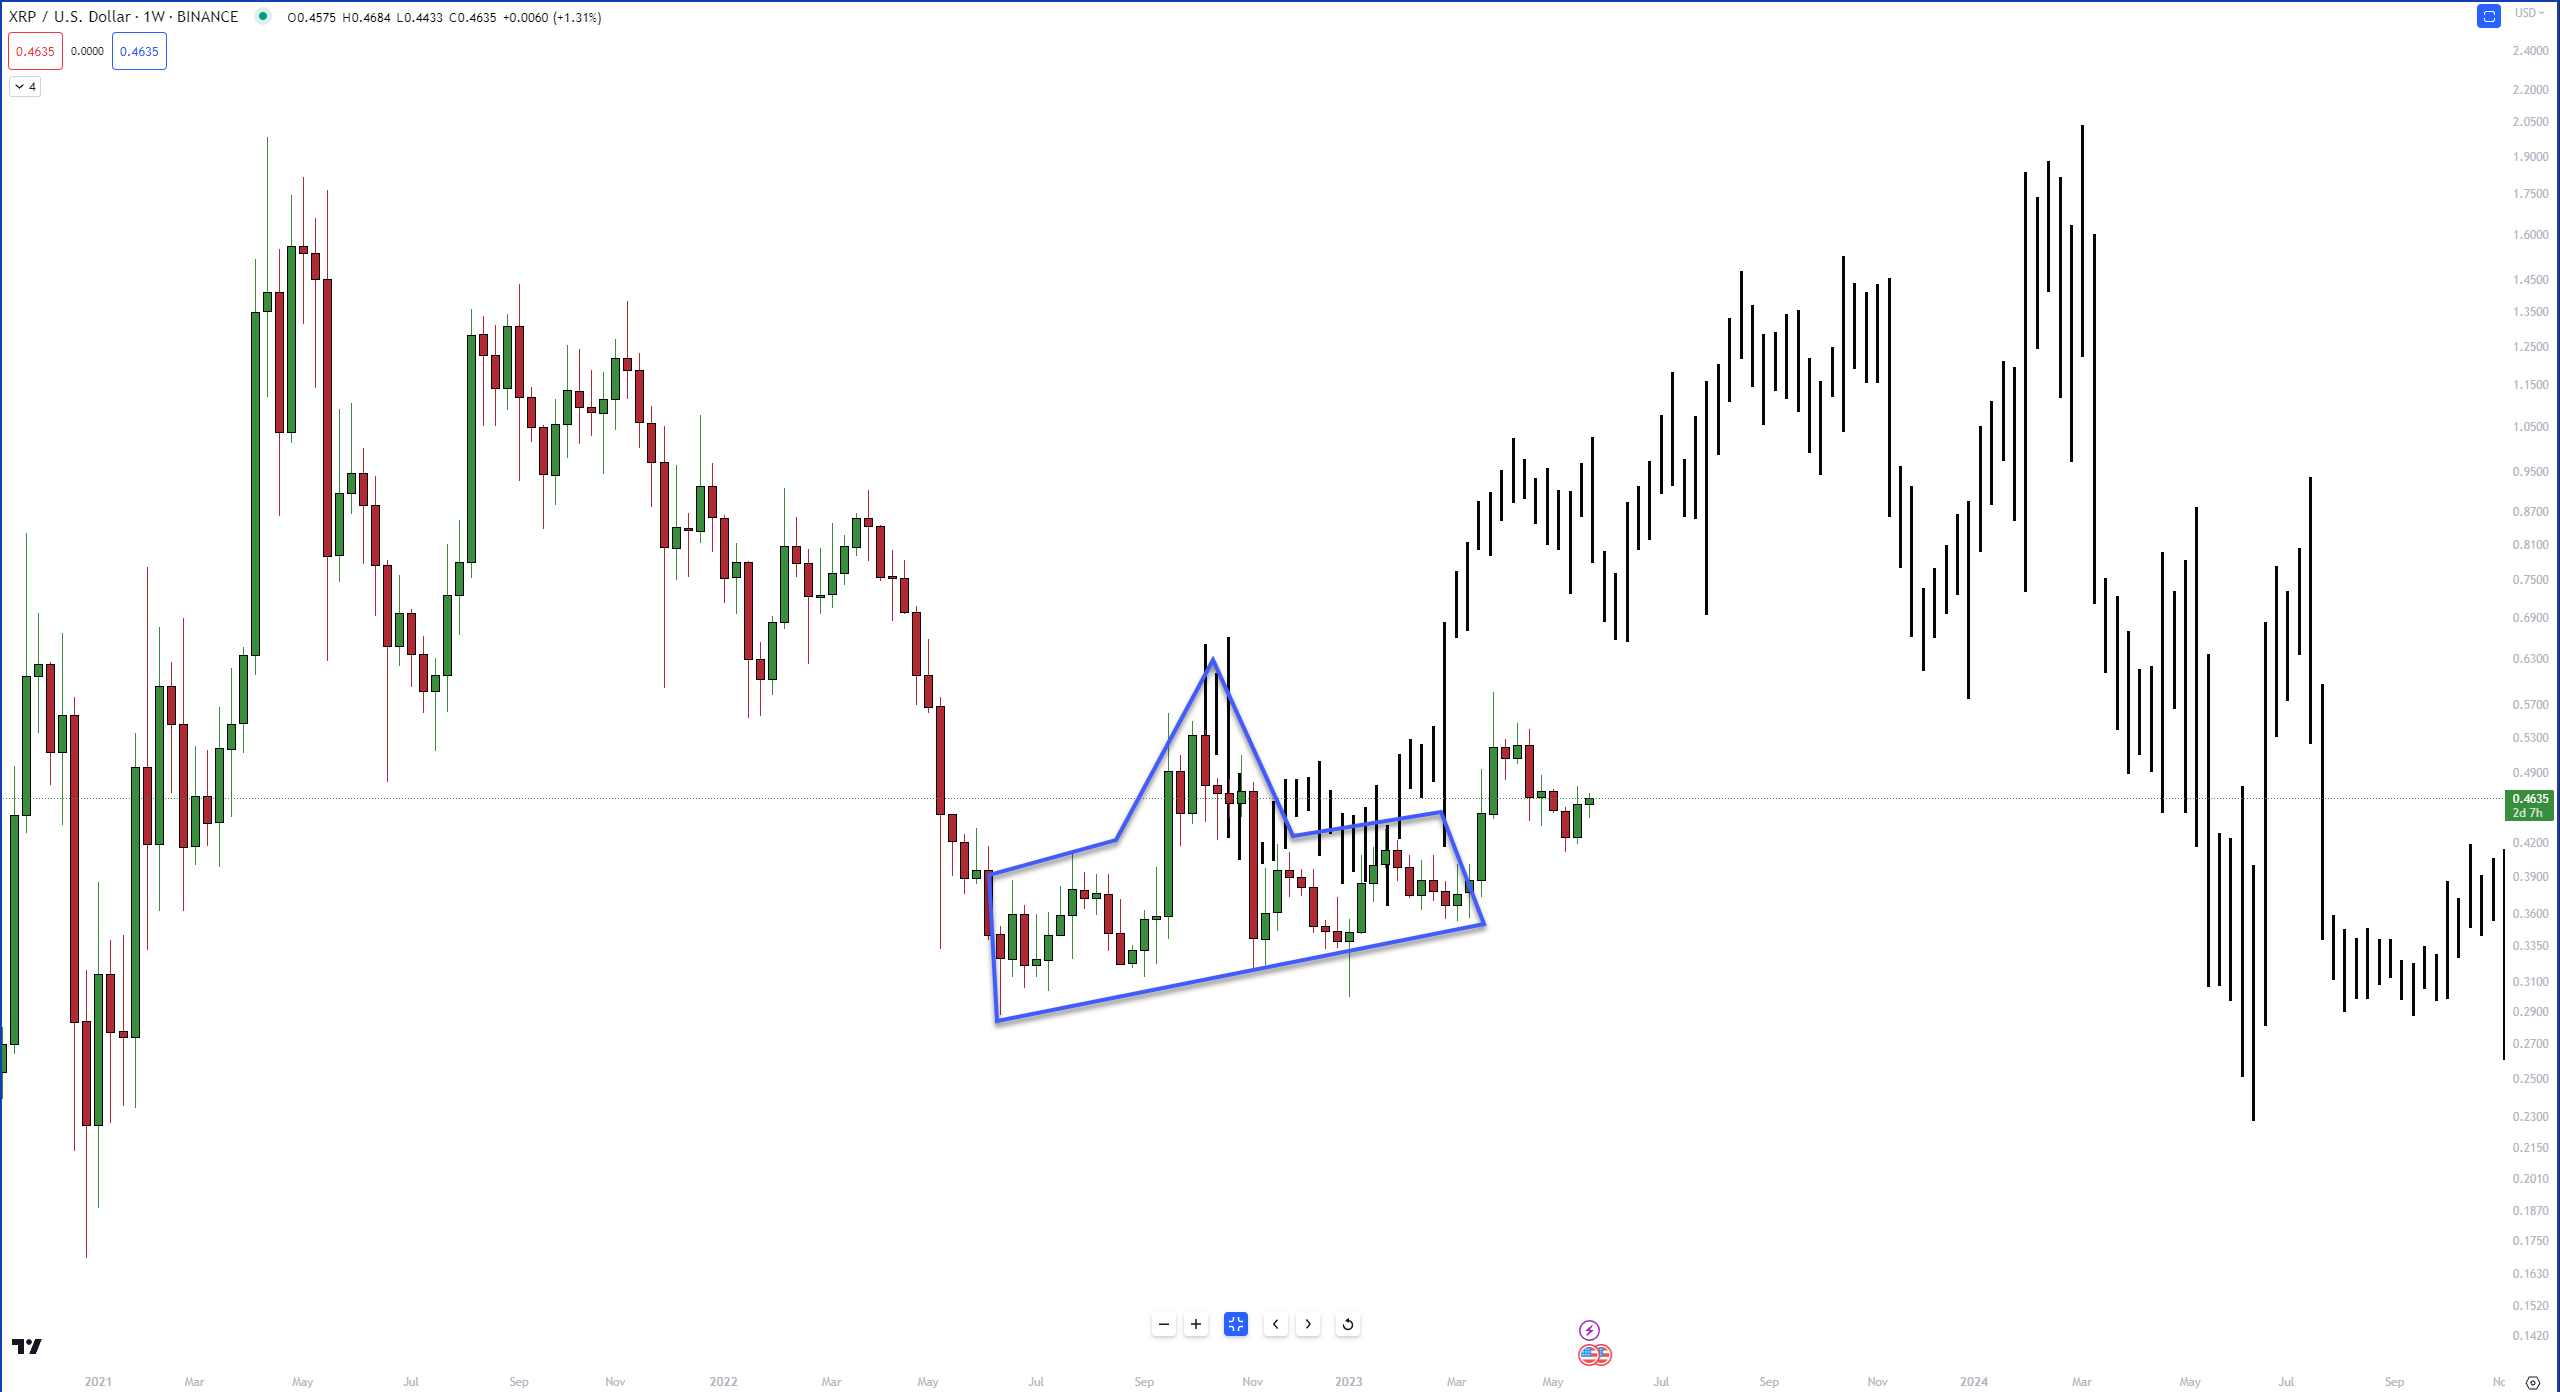
Make sure you click on the February 17, 2023, link above to learn more about how Foldback patterns work.
Cardano
For $ADA‘s look-back, we’re going back almost two months to March 6, 2023:
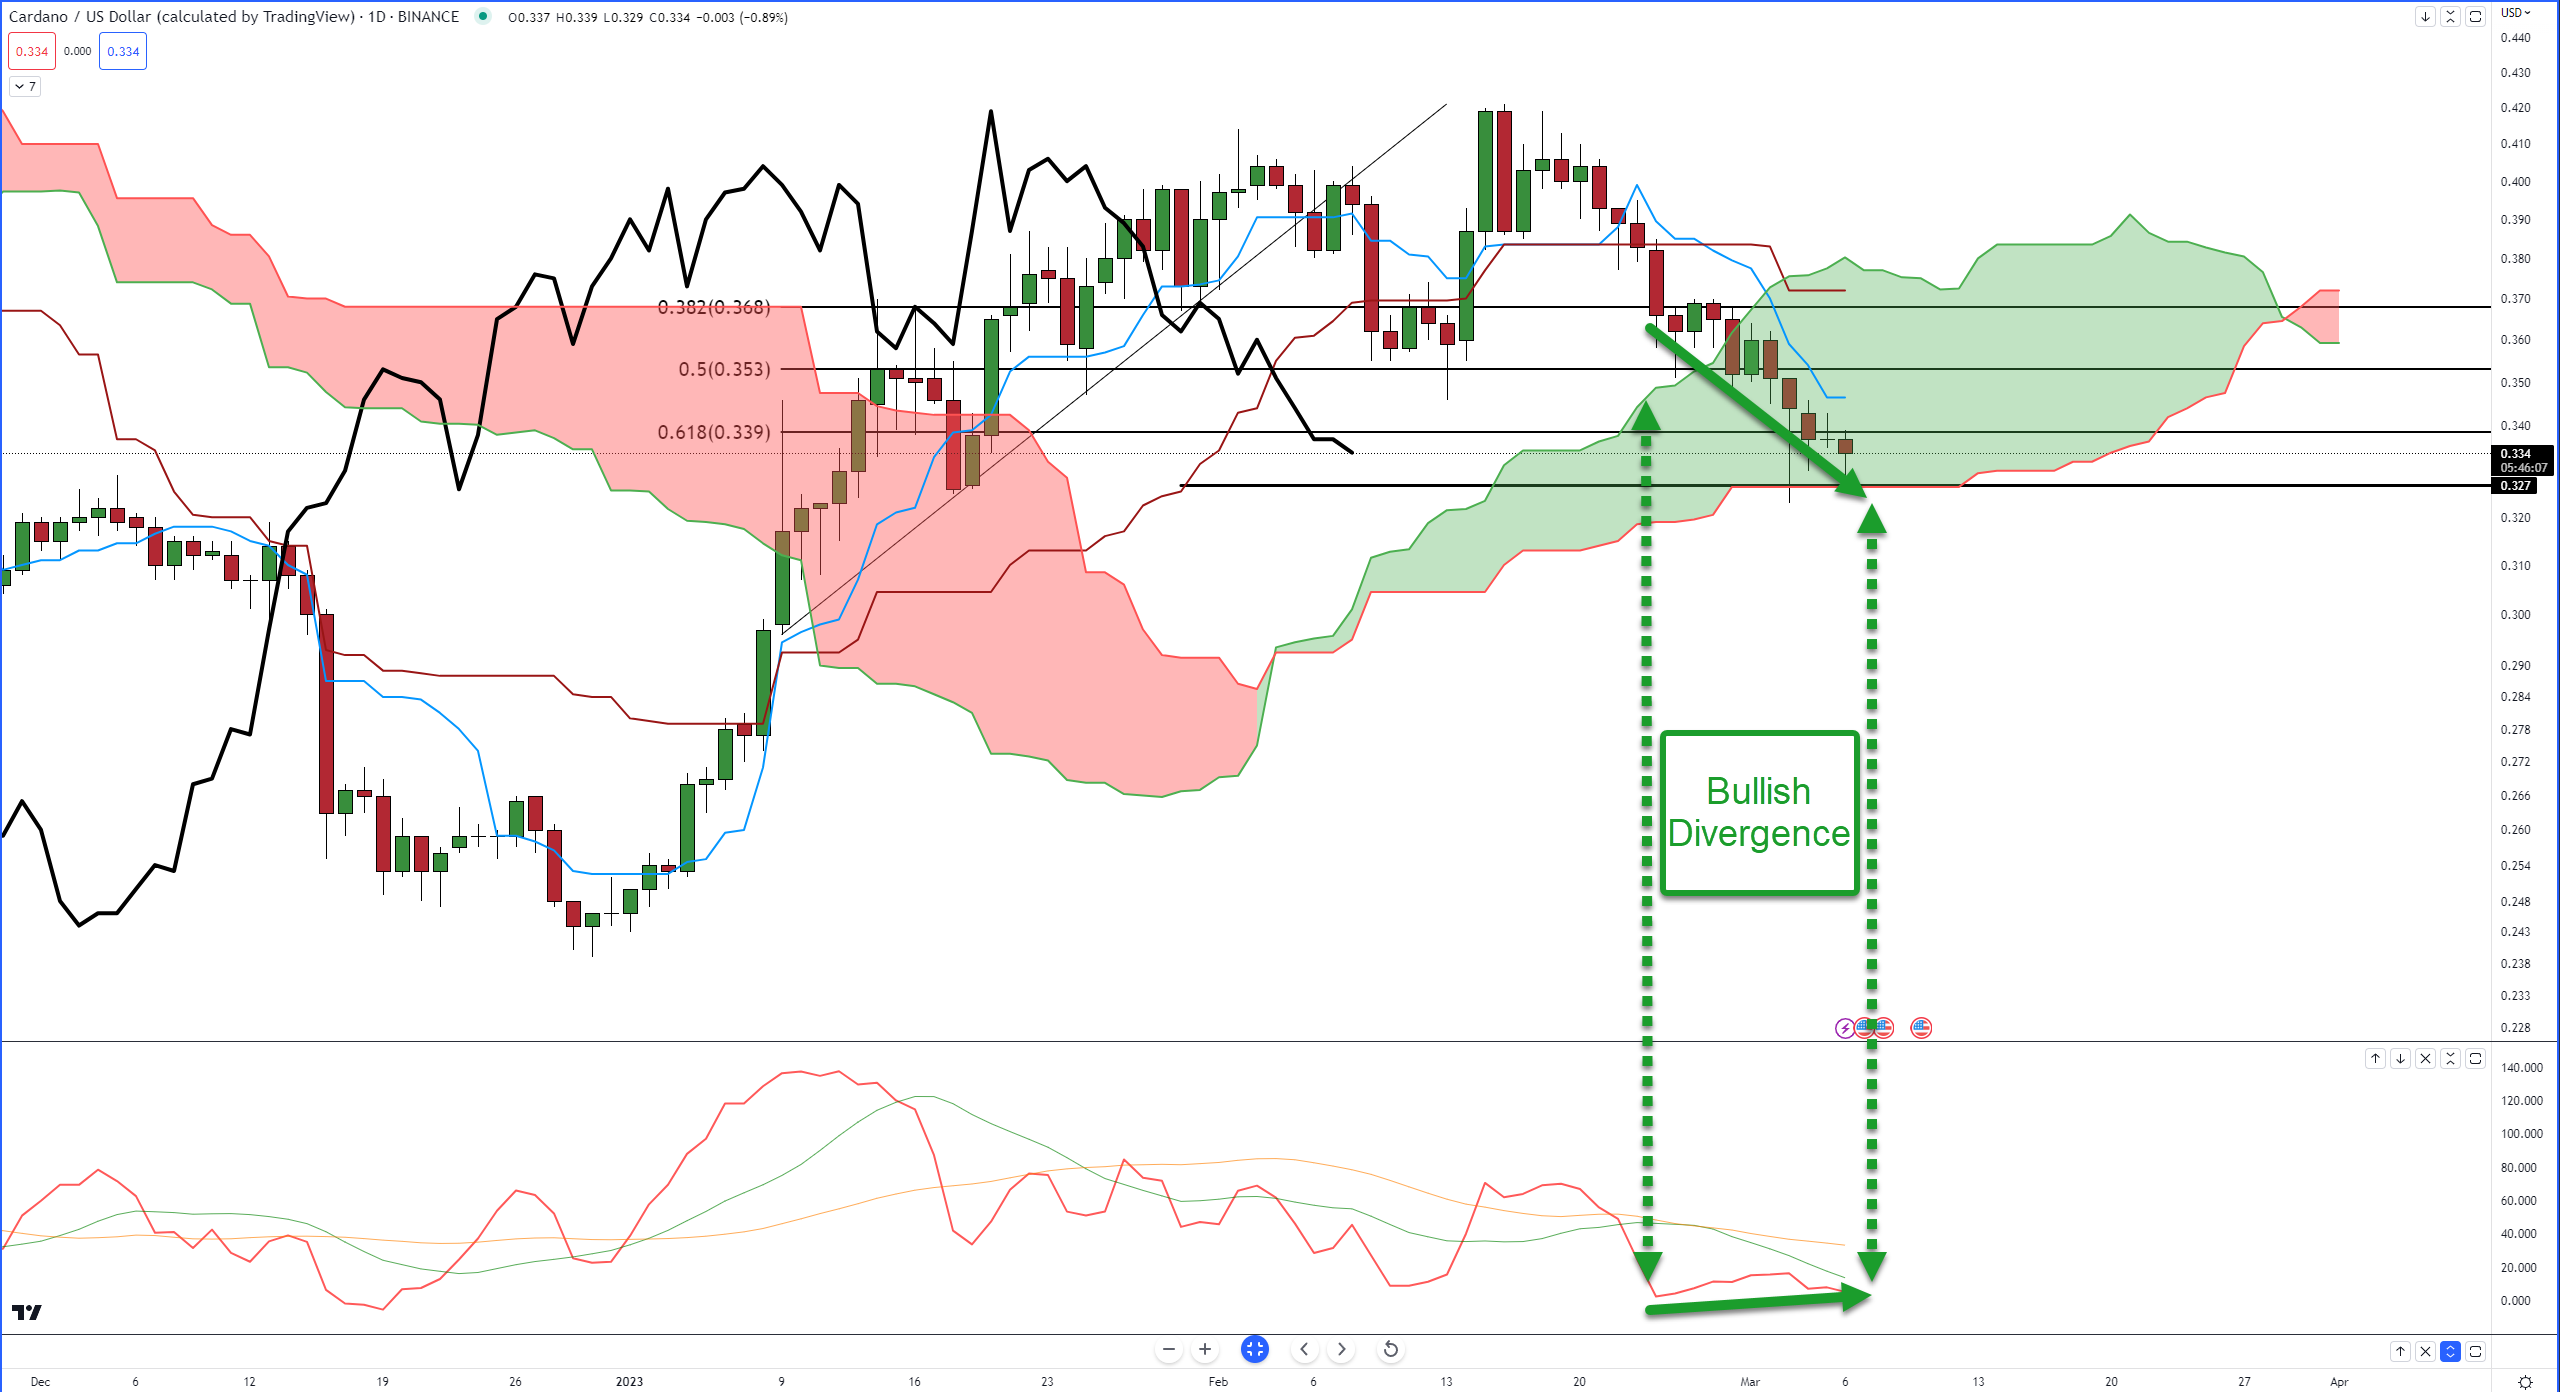
And here’s the analysis we looked at:
- $0.327 is the most powerful support/resistance level in the Ichimoku Kinko Hyo system (Senkou Span B).
- Bullish divergence.
- Today is the 17th day from the prior swing high. In the Ichimoku Time Principle, the number 17 is a primary number used to identify when major/minor turns could occur.
Now, let’s look at the current chart:
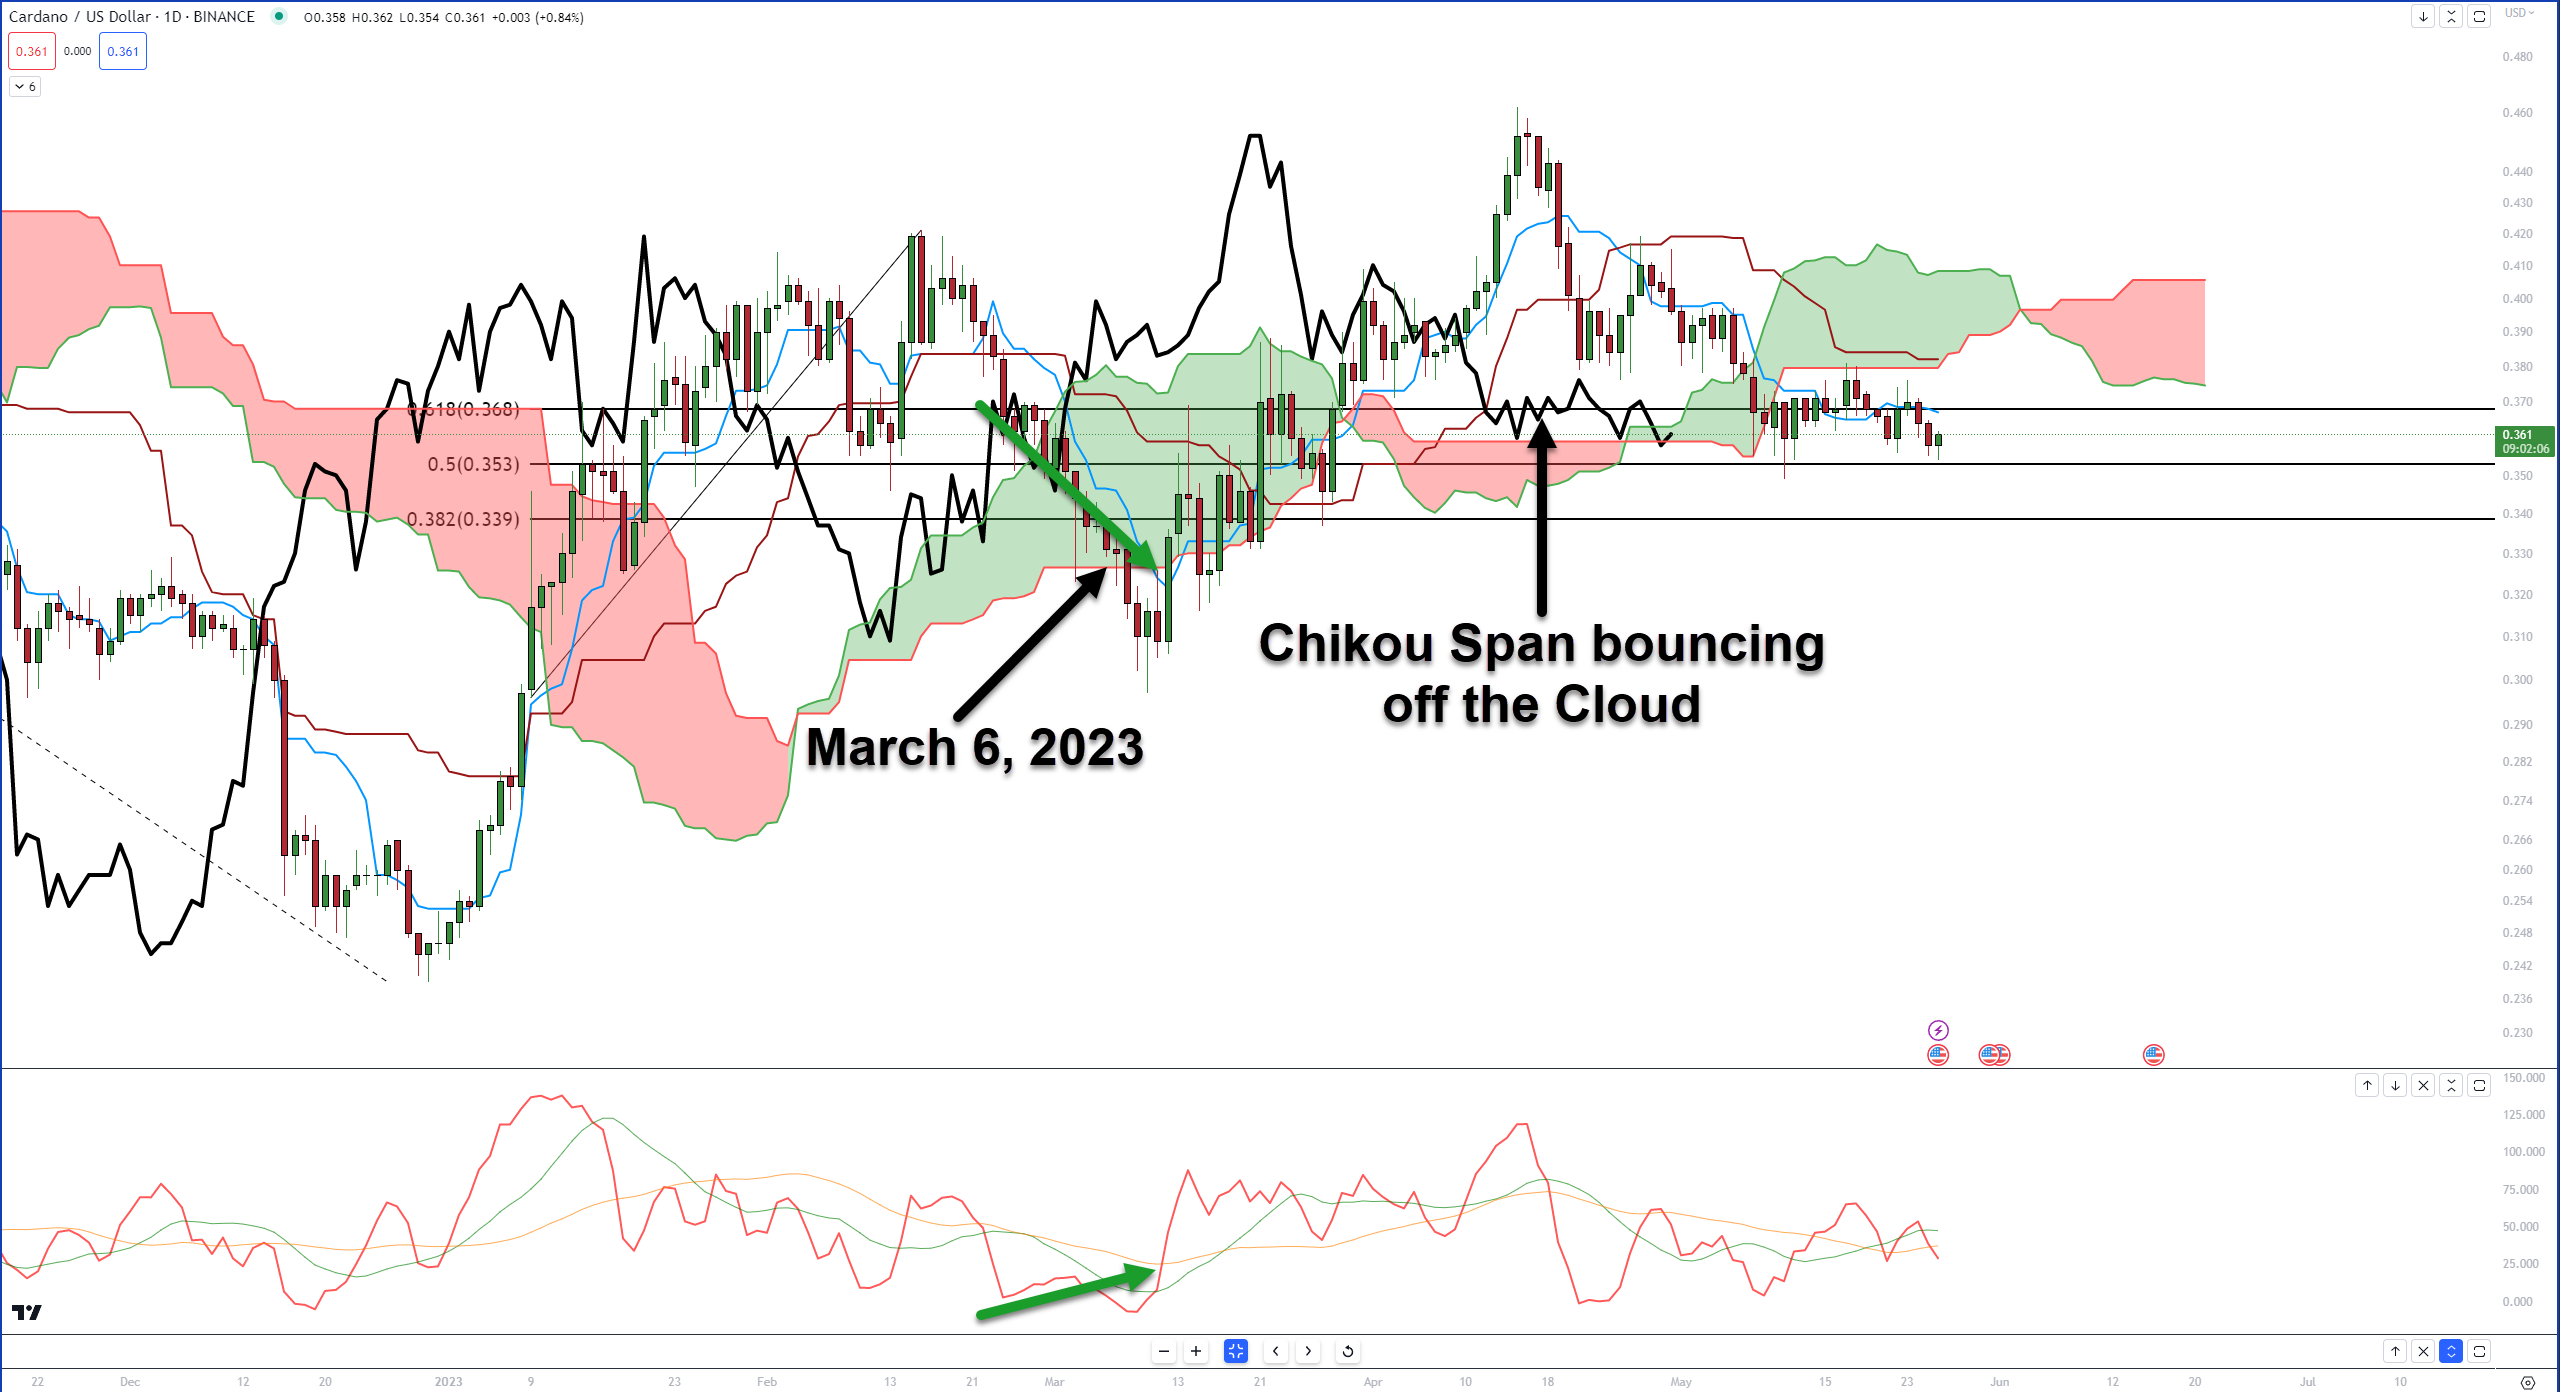
How did the analysis play out? It didn’t!
While price action did, eventually (4 days later), play out positively for the bulls, it didn’t find support against the Kijun-Sen, the bullish divergence didn’t play out, and the Time Principle didn’t work out either.
Why show failed analysis? Because it happens, and that’s normal.
One piece of analysis playing out is the Chikou Span’s behavior. The Chikou Span essentially serves as an additional candlestick within the chart, possessing the same propensity to respond to support and resistance levels as the present candlestick.
And just a heads up: there’s a Kumo Twist that occurs on June 2 – if ADA is trading flat or continues south around that date, there’s an increased likelihood that Cardano could bounce.
If, instead, Cardano starts to move up, then the Kumo Twist could signal a top – but if price moves through/above the Kumo Twist itself, then that would be an exceptionally bullish event. Keep your eyes open!