Yuck, ugg, damn, yikes, B.S. – take your pick – any of those words pretty much sums up how the bulls are feeling. After Friday’s nose dive, the weekend really didn’t give much hope of recovery. So what about today?
Heavy focus today on Bitcoin’s ($BTC.X) chart, highlighting the bullish and bearish technicals. Additionally, we’re going to look at ApeCoin ($APE.X) and the Bored Ape Yacht Club ($BAYC.NFT) price behavior.
Before we dive into the rest of today’s Litepaper, let’s see the sea of red:
| Cardano (ADA) |
$0.46
|
-1.30% |
| Binance Coin (BNB) |
$298.08
|
-0.99% |
| Bitcoin (BTC) | $21,154 | -1.59% |
| Dogecoin (DOGE) |
$0.068
|
-2.31% |
| Ethereum (ETH) |
$1,584
|
-2.06% |
| Polkadot (DOT) | $7.30 | -1.88% |
| Solana (SOL) |
$34.99
|
-4.01% |
| XRP (XRP) |
$0.33
|
-1.60% |
| Altcoin Market Cap |
$584 Billion
|
-1.38% |
| Total Market Cap |
$989 Billion
|
-1.48% |
Oof. Last week was brutal for bulls. Well, it was brutal for short-term traders who are long and anyone who has leveraged longs. For long-term bulls, the lower prices go, the happier they get. By the way: if you want to skip the nerdy bits with Elliot Wave Theory, just fast forward to the end of this article for the price levels to watch.
Bitcoin’s ($BTC.X) close on the weekly chart for last week is a great example of what ugly looks like (for bulls). Bitcoin hit the $25,000 level only to be smacked down to the $20,000 zone, ultimately closing just a hair below $21,500.
The candlestick for last week was one of the most sought-after bearish candlestick patterns: a Bearish Engulfing candlestick. The bearish engulfing candlestick is often a precursor to strong and renewed/continued downside movement. But a single candlestick pattern is not enough analysis.
Currently, Bitcoin’s price level at the $21,000 level makes things a little tricky.
If you want a topic that will make Technical Analysts begin a fight like Anchor Man 2, bringing up Elliot Wave Theory is a great way to do it. I’m not going to waste your time going through a watered-down version of ‘this is what Elliot Wave Theory is.’
If you don’t know anything about Elliot Wave Theory, that’s fine – because all you want to know is how low Bitcoin could go and/or if the downside movement will stop soon.
Bearish Continuation Case With Elliot
Assuming Bitcoin has another leg lower, extending to a 5th Wave, Bitcoin may have a deeper trip south than some expect. Wave 5 is usually:
- The inverse 123.6% – 161.8% of Wave 4
- Equal to Wave 1
- 61.8% of Wave 1 + 3
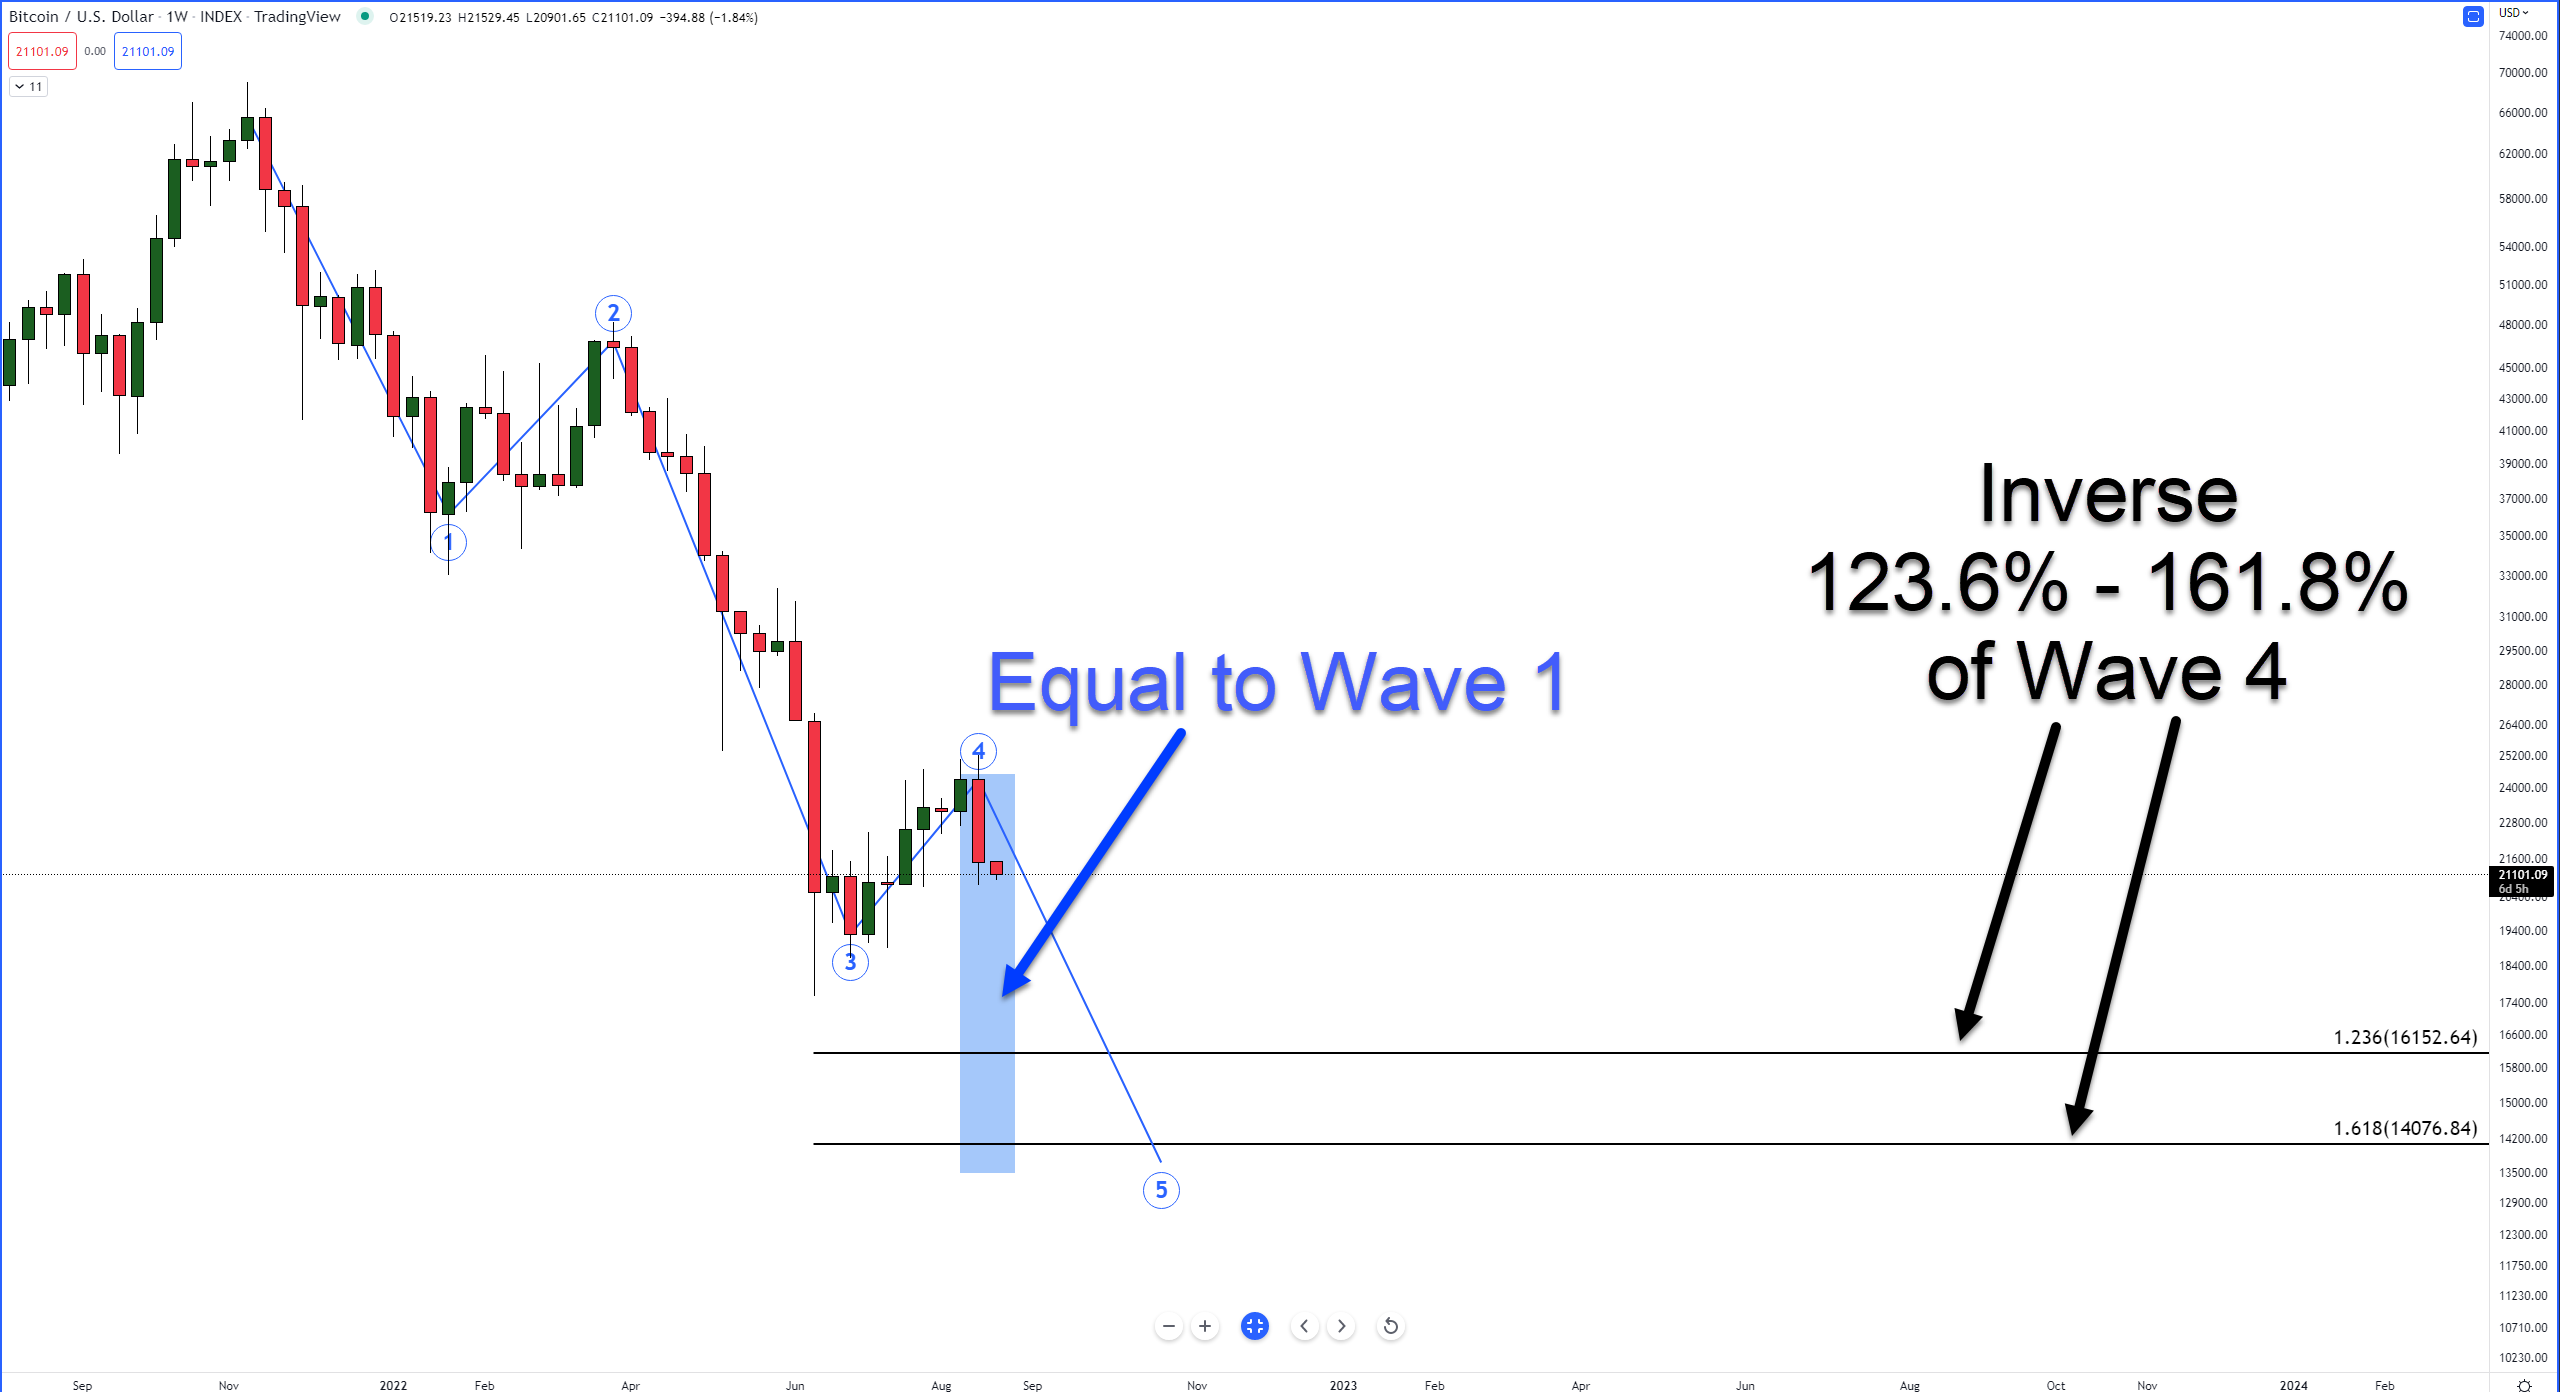
The blue column is the range equal to Wave 1, which puts Bitcoin in the $13,500 value area. The 123.6% and 161.8% Fibonacci levels are the inverse Fibonacci retracements of Wave 4. From this perspective, Bitcoin has a range between $13,500 and $16,000 to complete Wave 5.
Bullish Reversal Case With Elliot
On the bullish side of the analysis, the hypothesis is an A-B-C Corrective Wave is already complete. This particular type of Corrective Wave is known as a Simple Zigzag. One of the key reasons some analysts may believe that the A-B-C Corrective Wave is complete is because of the factor of time.
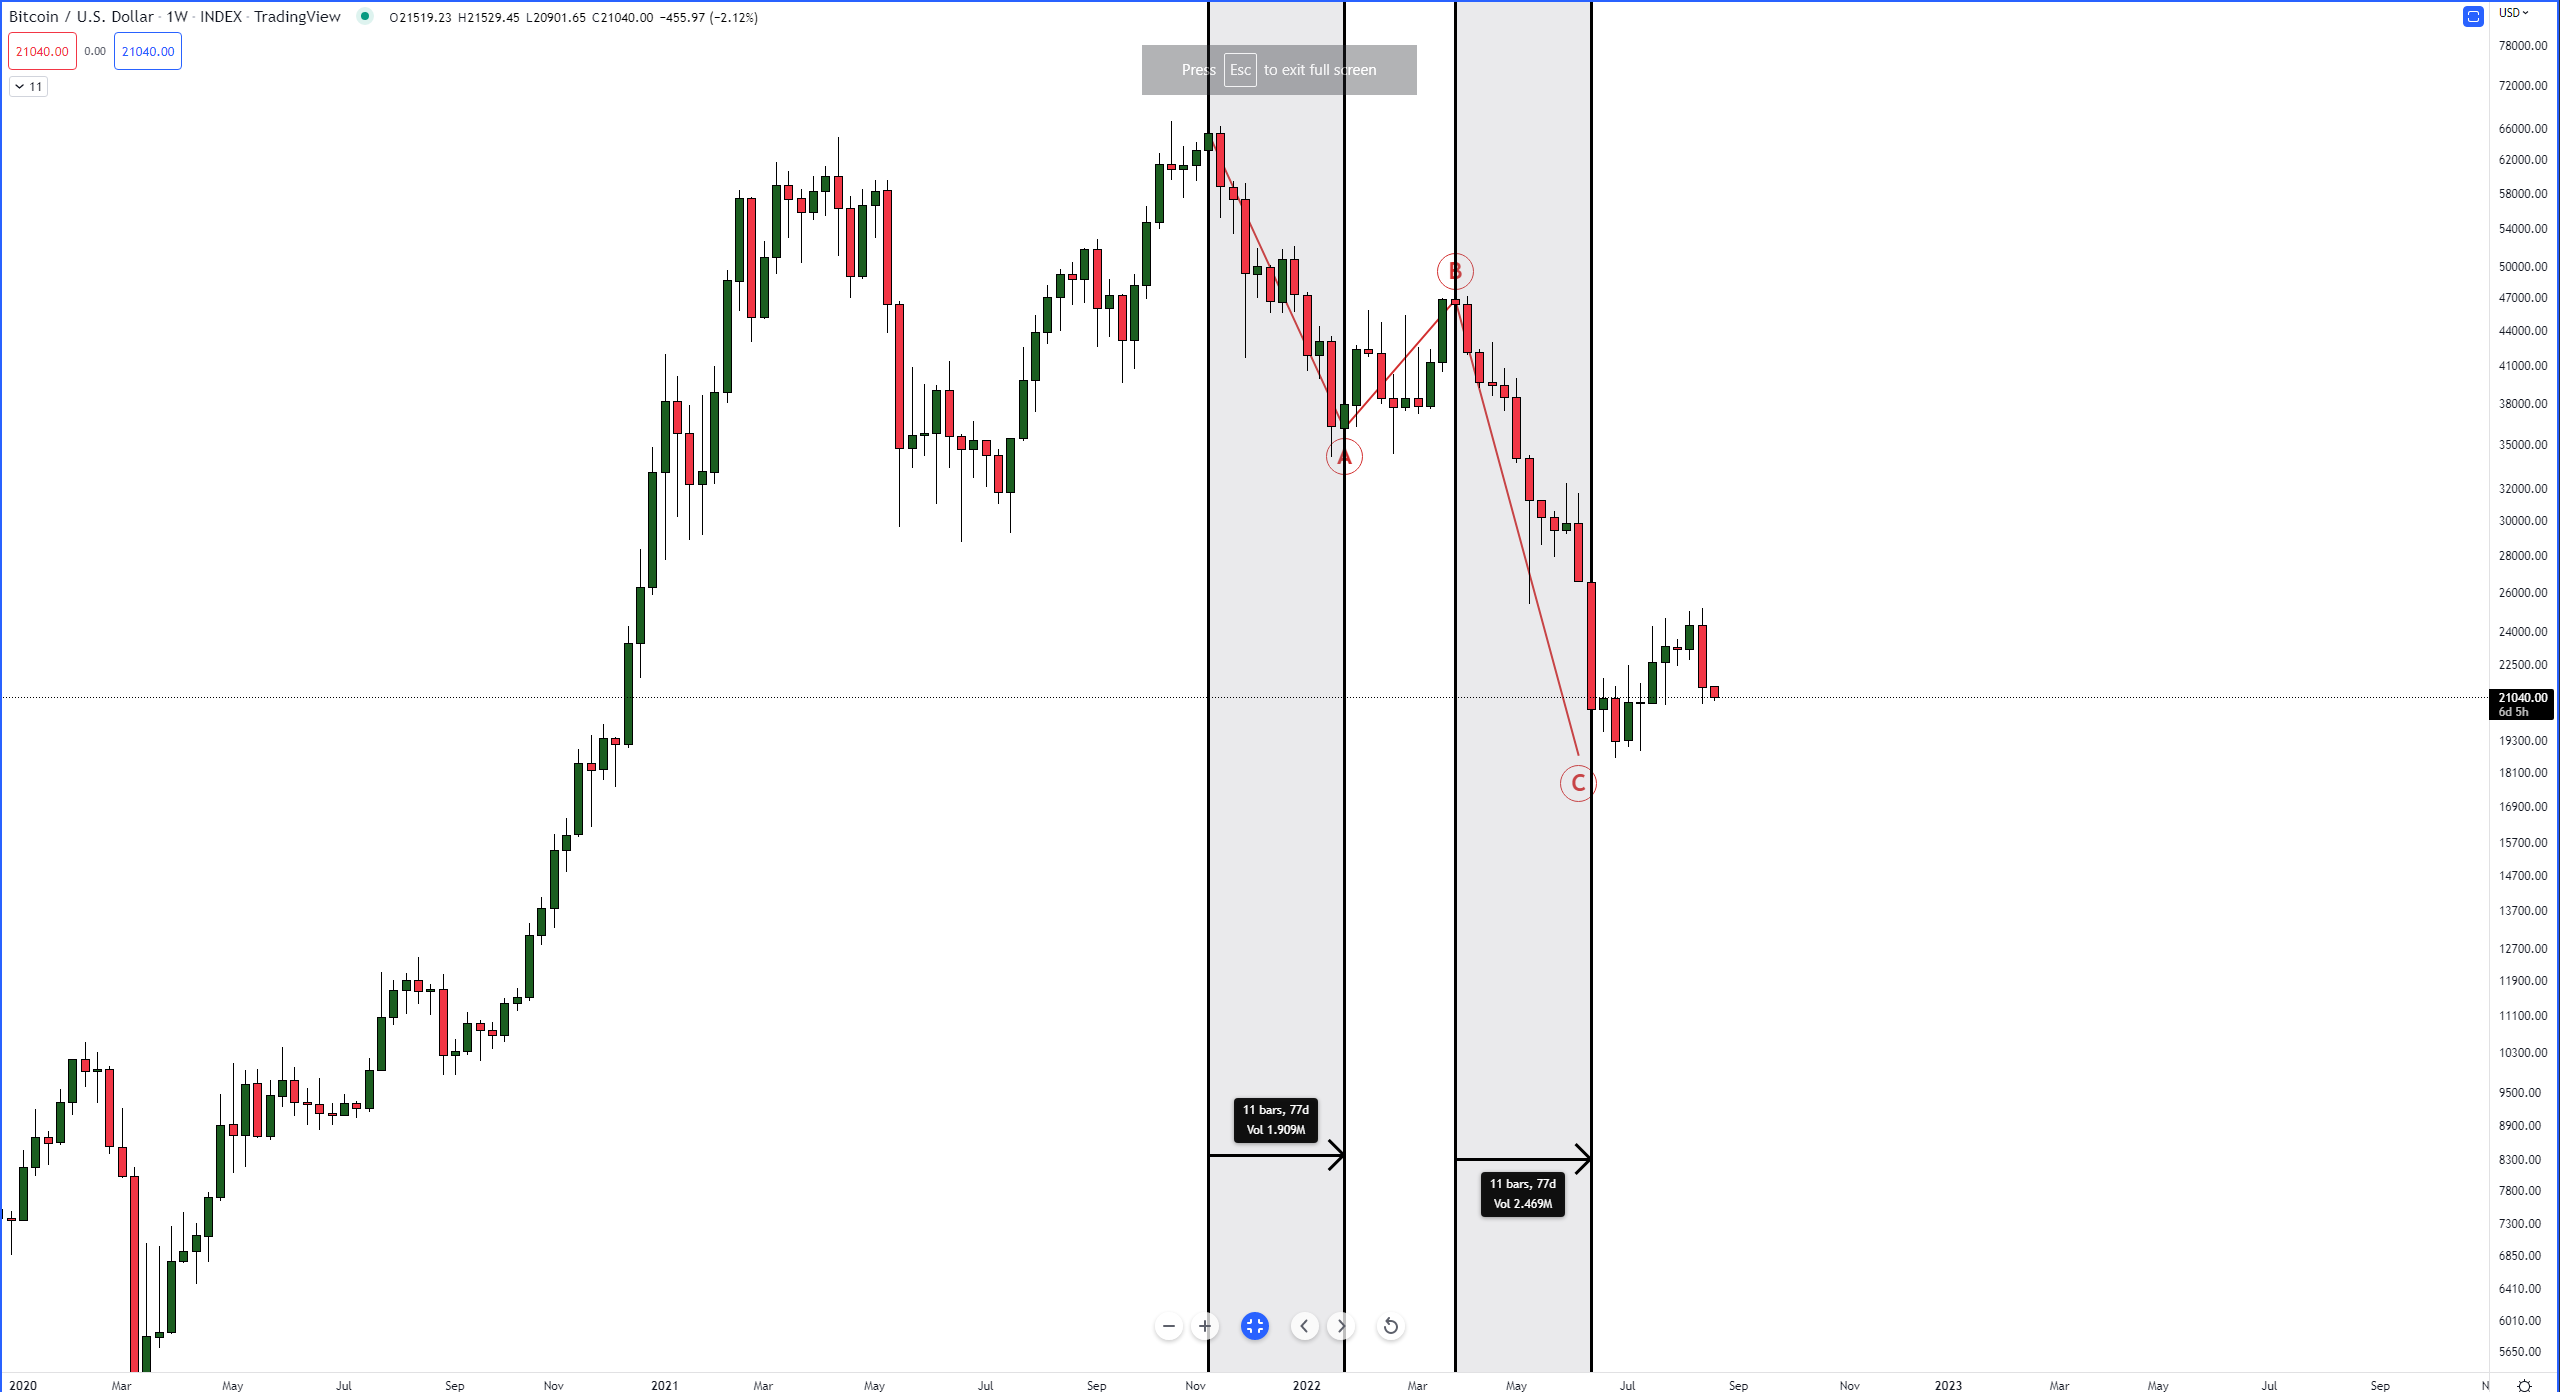
The Simple Zigzag pattern is one of the only Wave patterns in Elliot Wave Theory with a time rule. Wave C needs to equal the time of Wave A. Is it? On the weekly chart, Wave A is eleven bars, and Wave C is eleven bars.
I’ll end the Corrective Wave analysis and construction there – more could be added, but this is already getting into the over-the-top realm. Hey, if you’re still with me, great!
Moving to the daily chart, the structure here changes quite a bit. In fact, from a daily chart perspective, nothing here looks like there’s an opportunity for being bullish. And as far as where Wave 1 ends – no one knows yet.
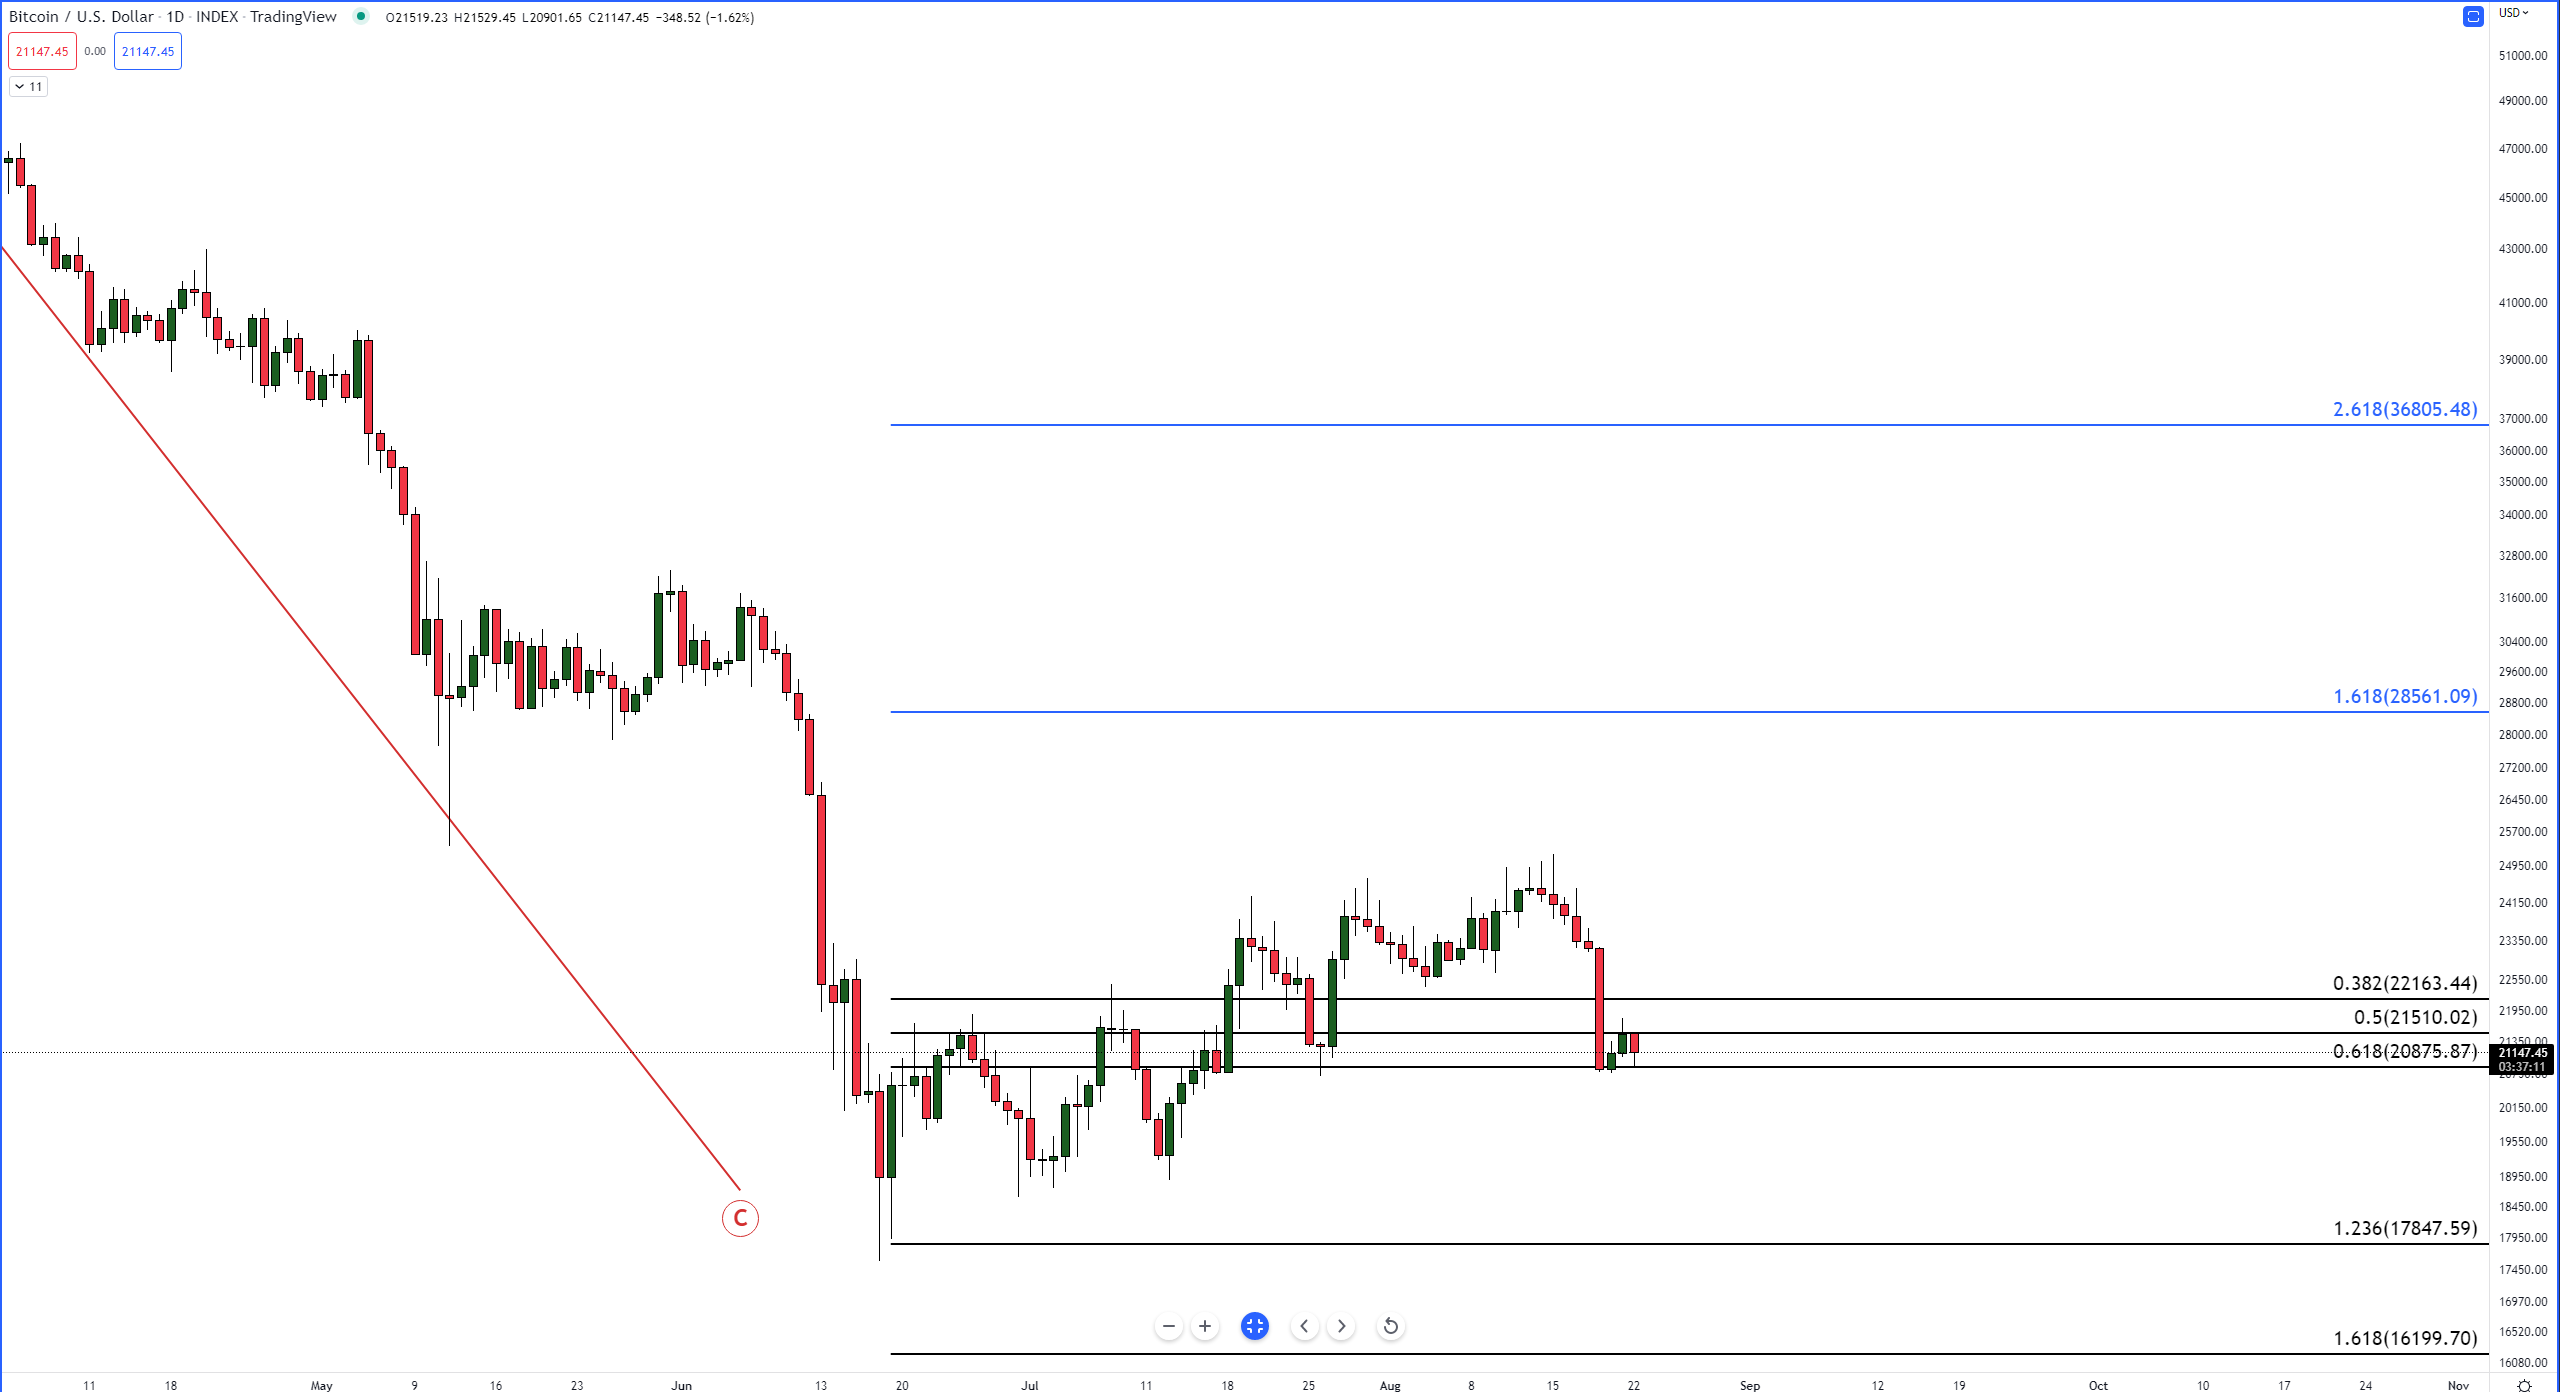
Let’s take what’s formed so far. First, it doesn’t really look like an appropriate structure on the daily chart to confirm a Wave 1 – but if we do a Fibonacci retracement of the prior upswing, then Bitcoin has retraced enough of that last move to equal Wave 2 – but, again, the structure just isn’t there on the daily.
Price Levels To Watch (Bulls) – Rule 1 in Elliot Wave is that Wave 2 can’t move below Wave 1. If we get a daily close below 19,000, we’re likely looking at a deep drive south. If bulls close at or above $25,000, Wave 2 is likely confirmed. We know that Wave 3 is typically a 161.8% or 261.8% of Wave 1, which puts Bitcoin at $28,561 or $36,805, respectively.
Price Levels To Watch (Bears) – Like the bullish price level, watch for a return and close above $25,000 for a likely end to further downside pressure. A weekly close around the $19,000 level could indicate a potential move towards the $13,500 – $16,000 range.
Again, you’ve got an approach and analysis style mixed with staunch, hard, static rules combined with some dynamic and flexible interpretation; you’ve got a recipe for differences of opinion and outlook. 💎
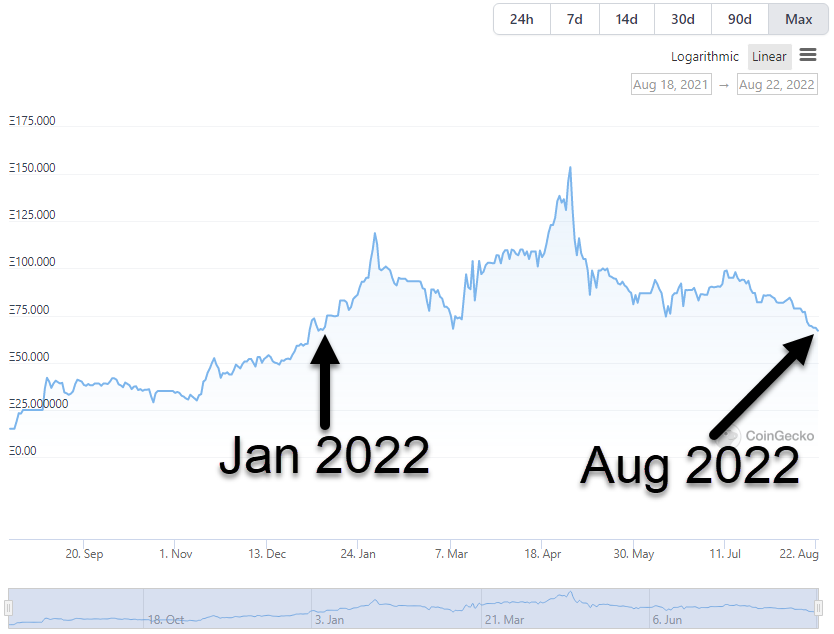
Before diving into ApeCoin’s ($APE.X) daily chart, I want to call your attention to the Bored Ape Yacht Club’s ($BAYC.NFT) floor price chart above. The current floor price of $67 Ethereum ($ETH.X) matches the lows found in January 2022.
There are legitimate fears in the NFT space that people who use their BAYC NFTs as collateral may face liquidation. The bearish environment extends to ApeCoin as well.
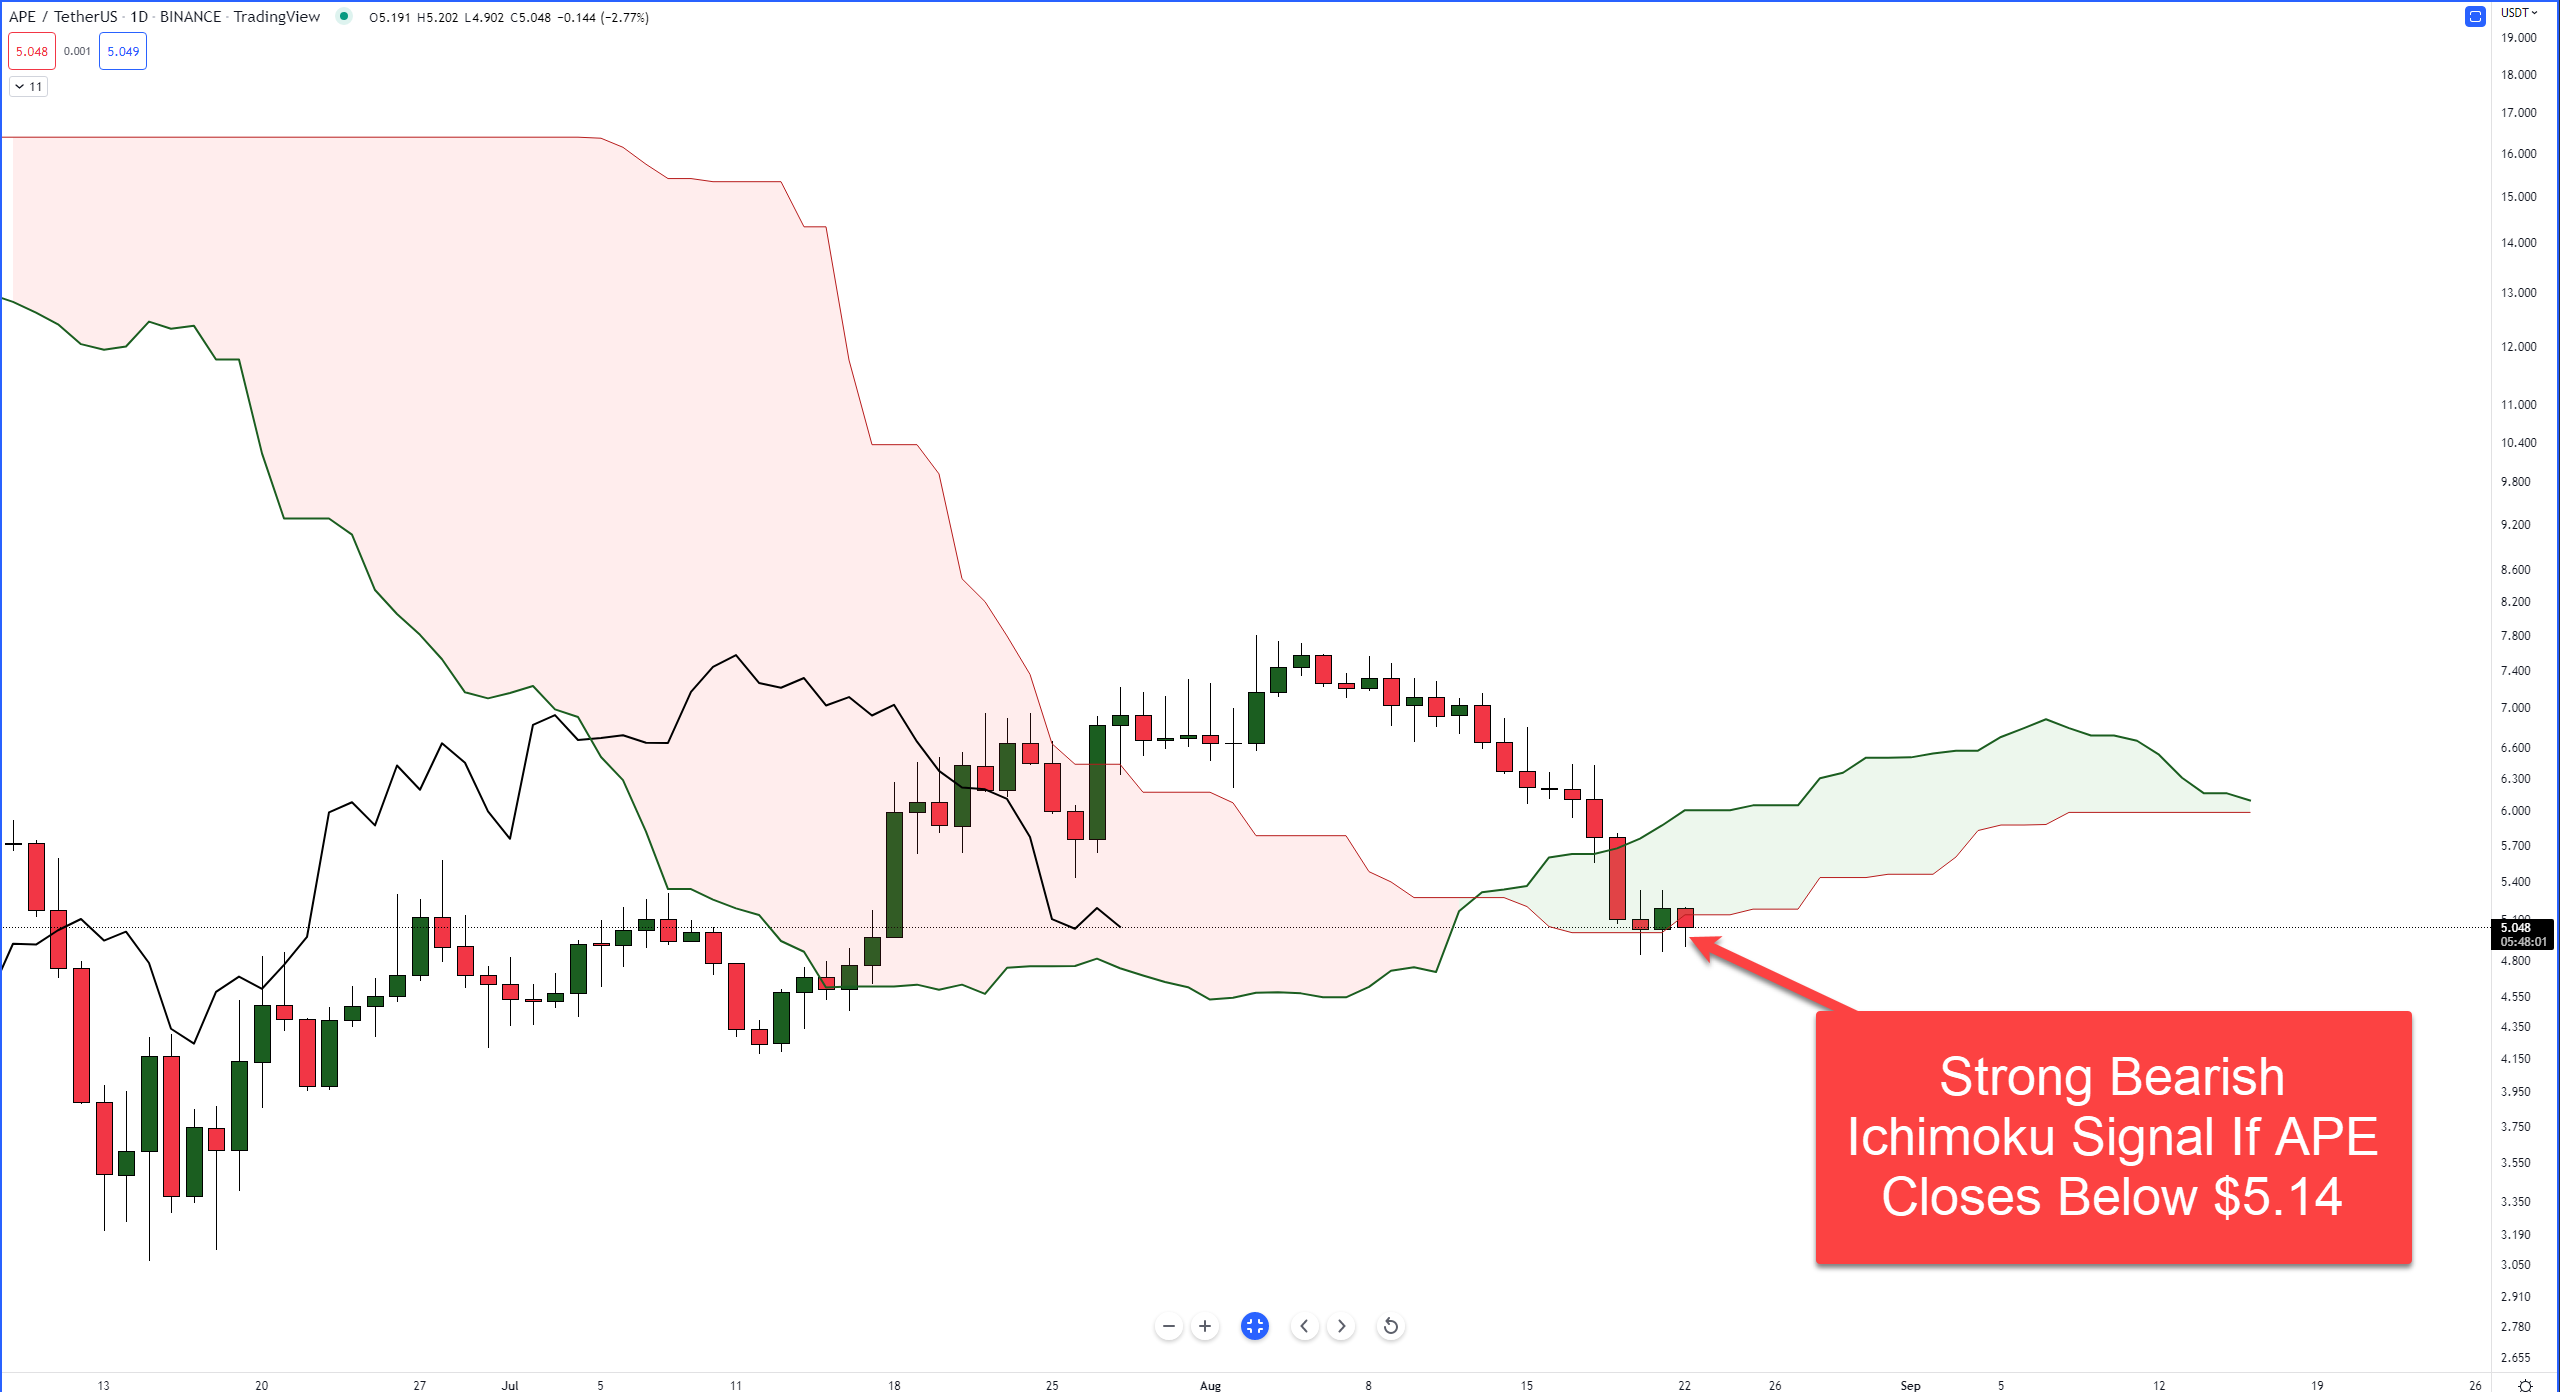
ApeCoin’s daily chart is up against a critical support zone that could trigger a substantial sell-off if it doesn’t hold. Within the Ichimoku Kinko Hyo system, one of the most sought-after bearish entry setups is developing: the Ideal Bearish Ichimoku Breakout.
Pro-tip: Click here to check out our introduction to the Ichimoku Kinko Hyo system.
Without going into too much detail, the final condition required for ApeCoin to trigger an Ideal Bearish Ichimoku Breakout is a close below the Cloud – at or below $5.14. However, there is a significant amount of danger to sellers ahead.
The Volume Profile on the image above begins at ApeCoin’s most recent major swing low of $3.06 on June 15, 2022. The red horizontal line is the Volume Point of Control (VPOC), representing the price level where the most buying and selling occurred.
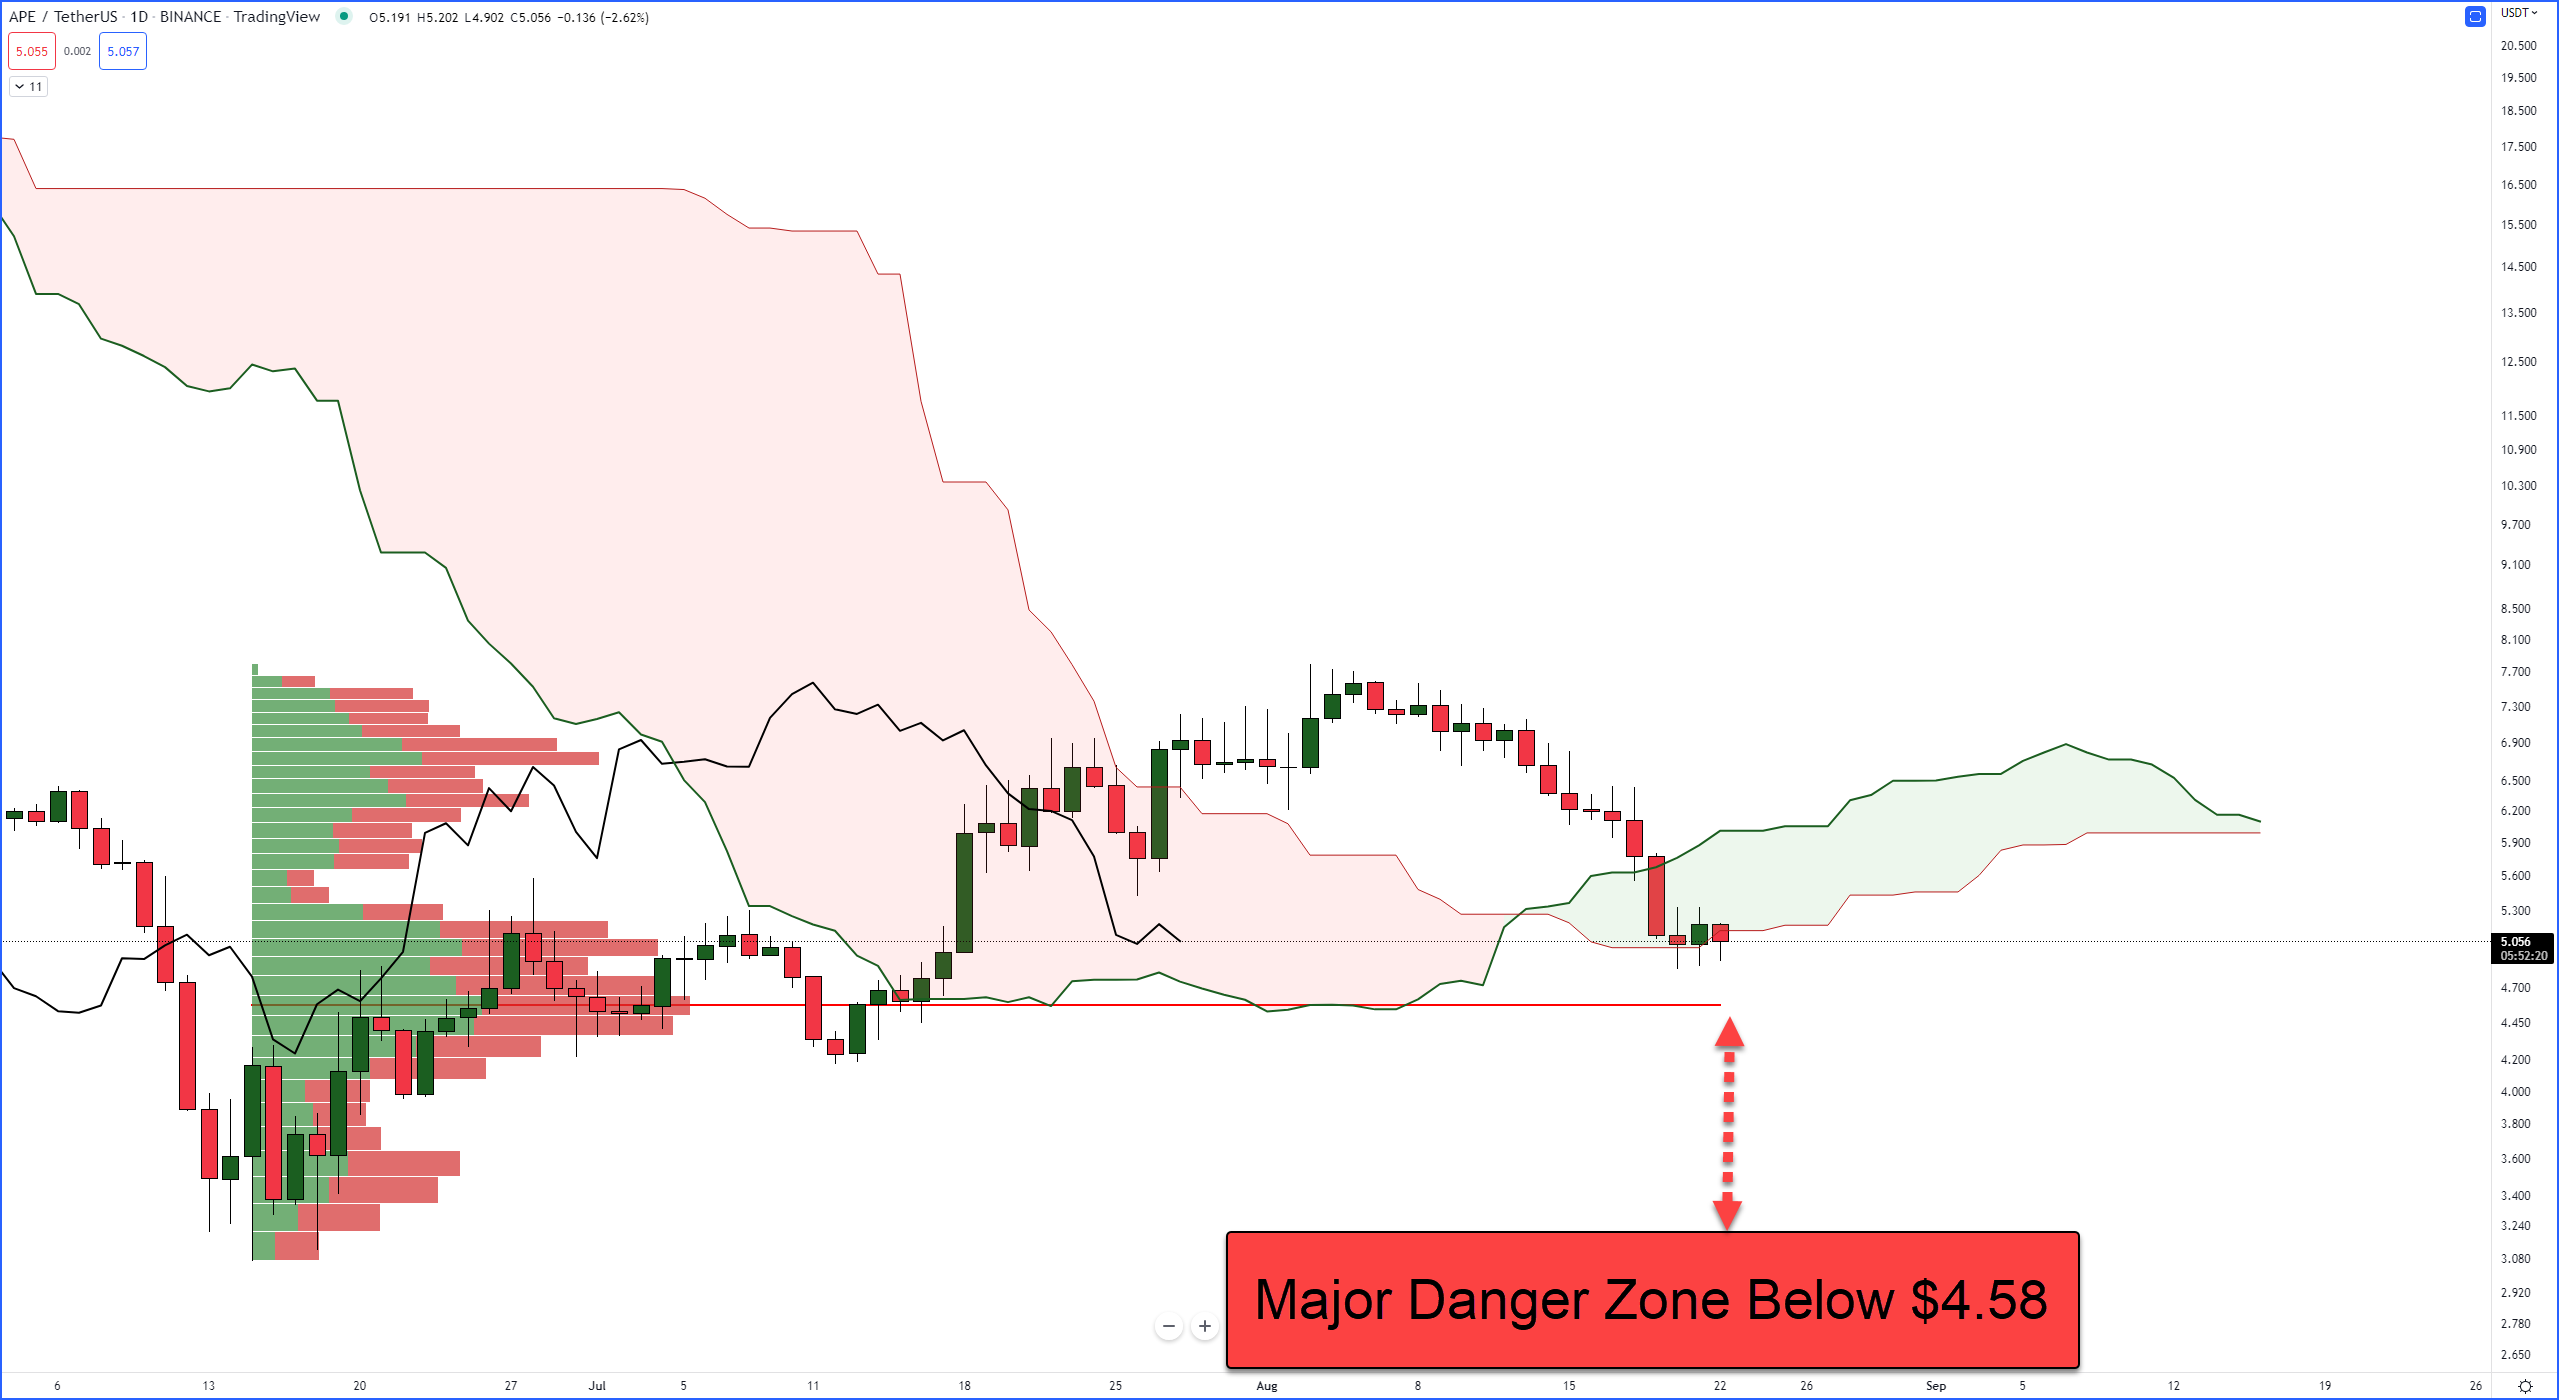
The VPOC is a powerful level of support and resistance. Currently, the VPOC is at $4.58. If you look where the Chikou Span is, you’ll notice that Senkou Span A shares the $4.58 value area with the VPOC. This is important because the Chikou Span will respond to the same support and resistance levels as the current price action.
Do note that the VPOC and Chikou Span will share the same value area for the next eleven days (Sept 2, 2022).
This means that, even if ApeCoin completes a daily close below the Cloud, there is still a good chunk of support that could prevent further downside movement. But what do the oscillators show?
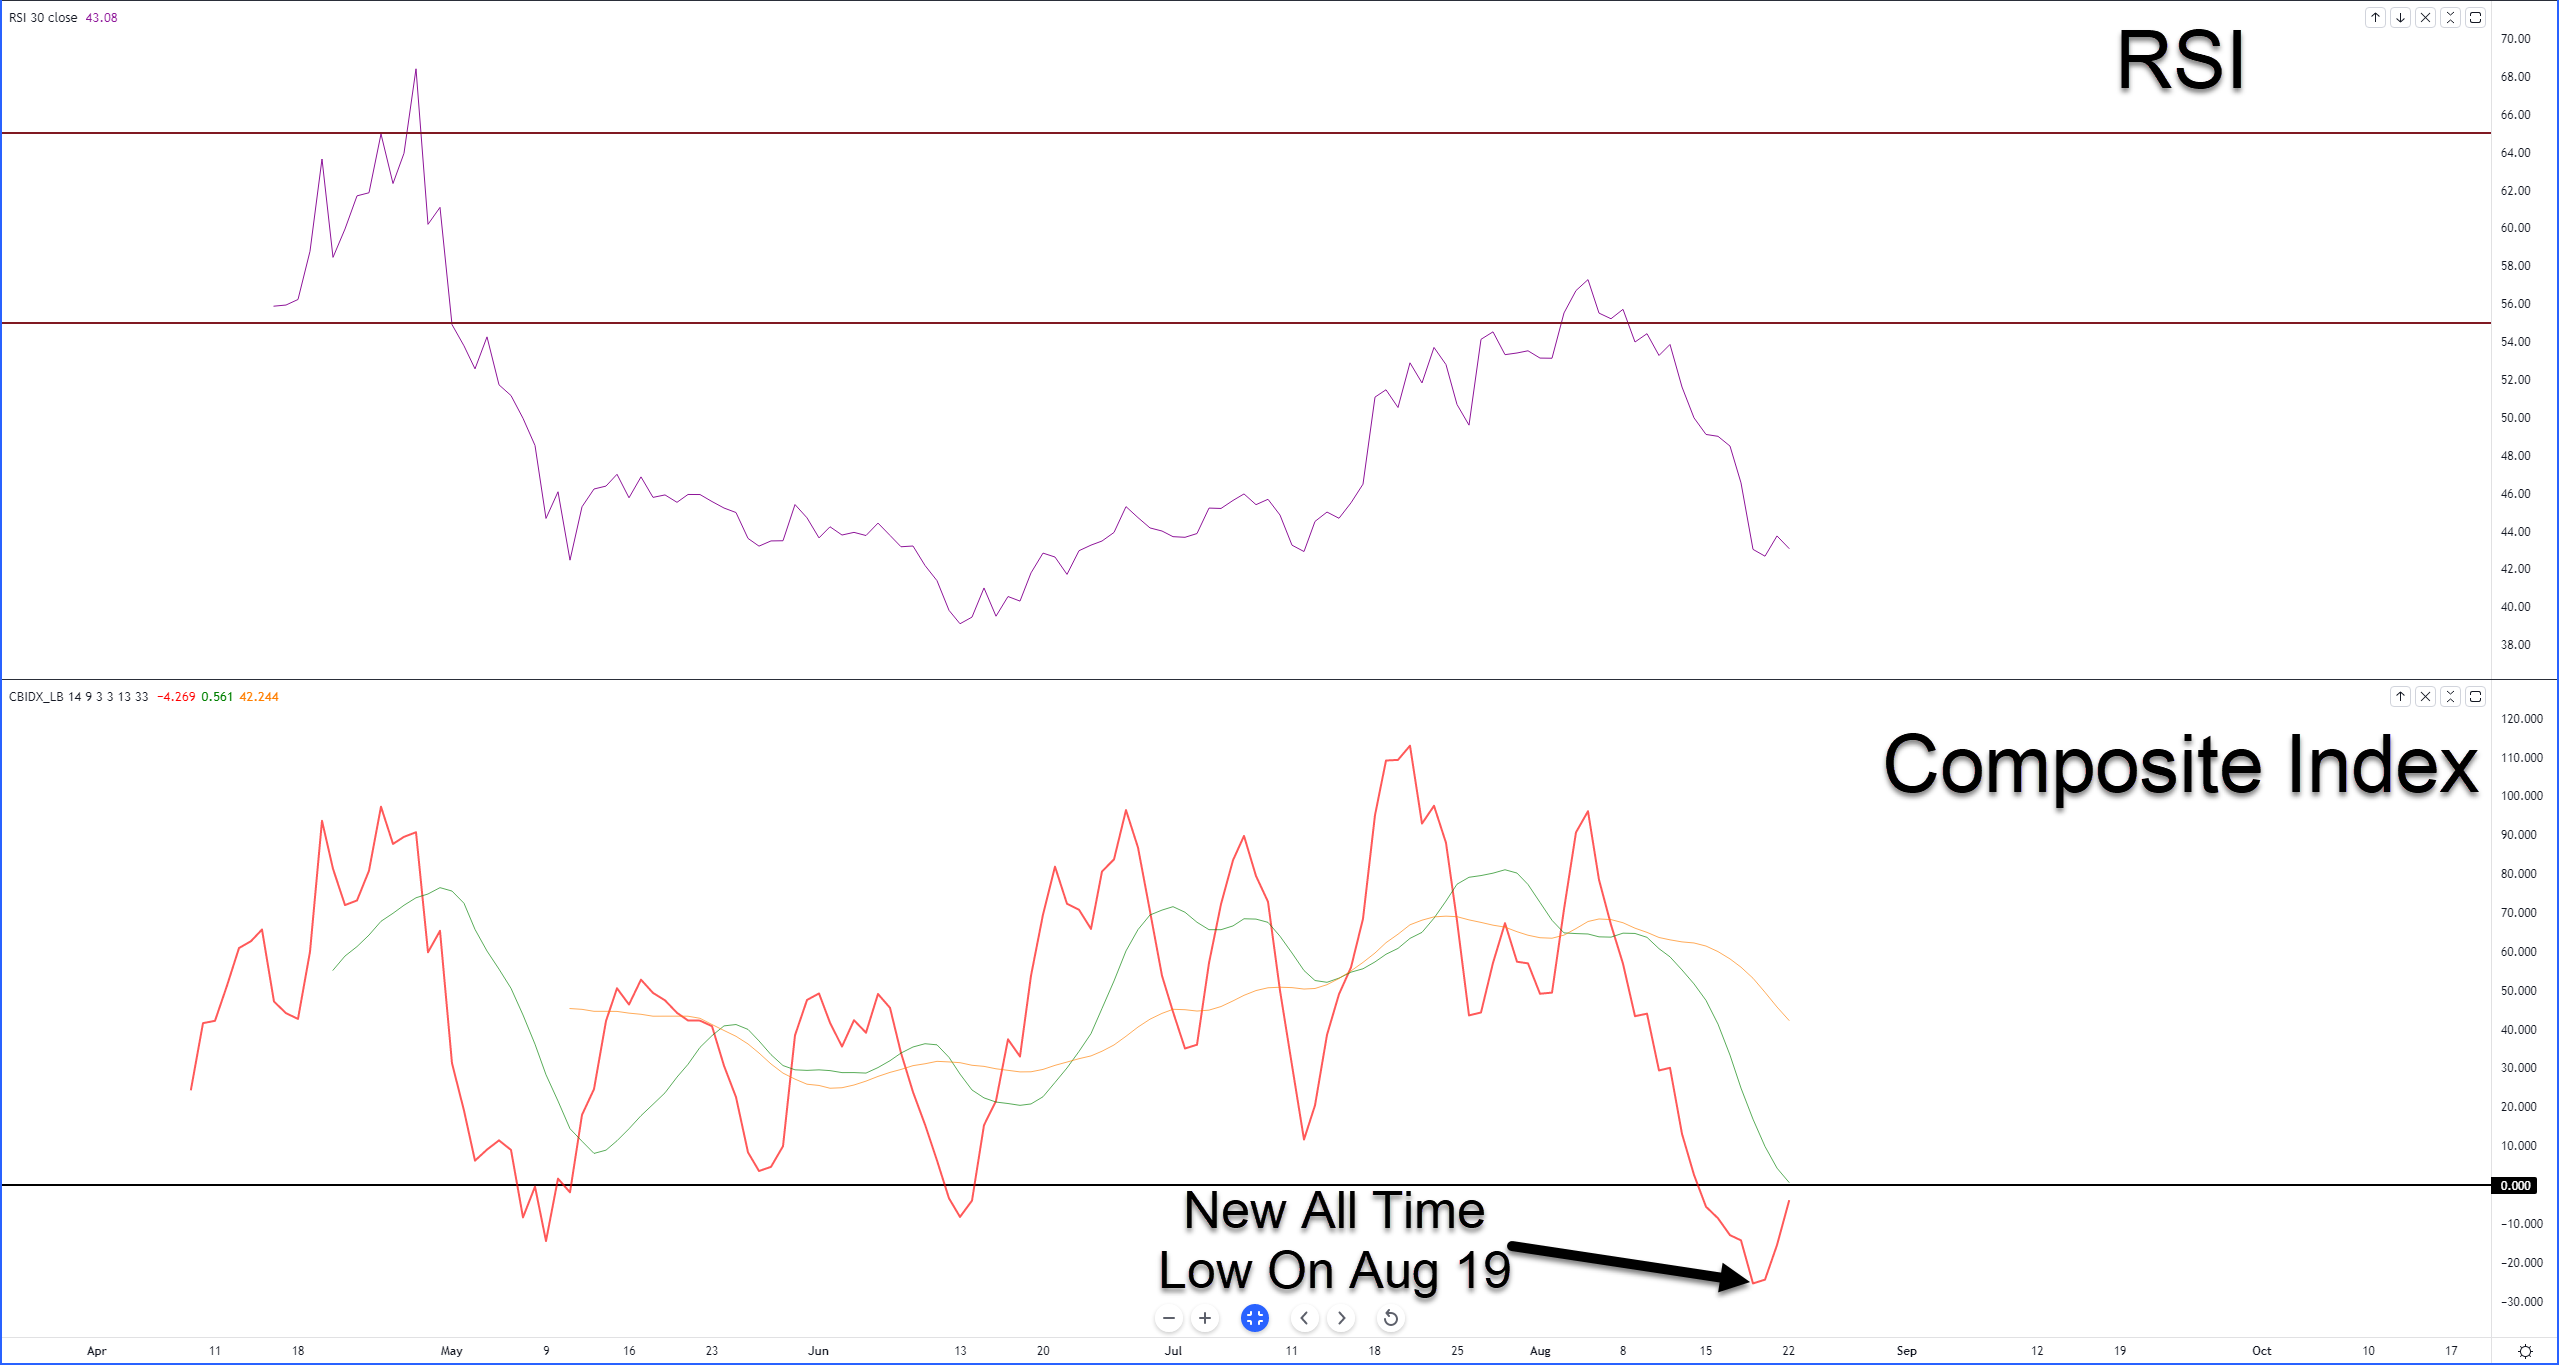
The oscillators in the image above are the Relative Strength Index and the Composite Index. The Composite Index, created by Connie Brown, is essentially the RSI but involves a momentum calculation. As a result, it (Composite Index) can detect divergences the RSI can’t.
For bulls, there is a strong reason to interpret a bounce for ApeCoin is coming because of the recent new all-time low formed in the Composite Index and a possible cross of the Composite Index Line (red) over its fast-moving average (green). The closeness of the potential cross-over to the zero level is extremely significant.
The Relative Strength Index shows that further downside pressure could remain very strong for bears. Using Connie Brown’s methods to interpret the RSI’s position, it is in bear market conditions. (Overbought is 55 and 65, Oversold is 30 and 20). So, because the RSI is still above 30, a strong drop below the Ichimoku Cloud could mean new 2022 lows.
If bulls want to see some evidence that the threat to further downside pressure has subsided, then they may have to wait. From an Ichimoku perspective, ApeCoin needs a daily close at or above $6.10 to eliminate most of the near-term bearish pressure. 💎
Bullets From The Day
Bullets From The Day:
🦧If you read the first article in today’s Litepaper, you’ll know that the floor price of the Bored Ape Yacht Club ($BAYC.NFT) dropped. As a result, fellow NFT giant CryptoPunks has moved into the top spot. Full story from TheBlock
🤖Tron’s ($TRX.X) Justin Sun states that their algorithmic stablecoin is more stable and safer than the recently collapsed TerraUSD ($UST.X). Considering every algorithmic stable coin has failed, the crypto community is understandably skeptical. CryptoSlate has the full scoop
🪨Anthony Scaramucci, the founder of Skybridge Capital, believes there is not enough attention to BlackRock’s ($BLK) introduction of a spot Bitcoin ($BTC.X) trust. Scaramucci iterated that this clearly signifies “… institutional demand out there.” More from the DailyHodl
Links
Links That Don’t Suck:
⚓Former OpenSea employee accused of insider trading files motion to dismiss indictment
🧑🚀 Cardano Now ‘Better Than Ever,’ Declares Ecosystem Dev Who Warned Of Catastrophic Testnet Issues
👨💼Invesco Offers Investors Exposure to Metaverse
🐳 Bitcoin whales attack sellers at $22.3K as euro drops below USD parity
🍞 Crypto Fans Launch Campaign for Arrested Tornado Cash Developer
⏩ SWIFT considered ‘neutral’ on sanctions; debate sparked on whether Ethereum is the same