It’s kind of an ugly day out there in the crypto world. Bitcoin ($BTC.X), Ethereum ($ETH.X), and the rest of the market are close to pushing double-digit daily losses, adding to an already bearish week overall. But really, it’s a mixed bag overall.
That’s what the Litepaper will focus on today. Another heavy dose of Technical Analysis puts things into perspective. We’ll be looking at the Total Market Cap chart for some hints to where this market might be headed, but also a deep dive into two memecoins (but high market caps): Dogecoin ($DOGE.X) and Shiba Inu ($SHIB.X).
But first, here’s what the crypto market looked like at the end of today’s regular trading session:
| Cardano (ADA) |
$0.47
|
-8.98% |
| Binance Coin (BNB) |
$287.20
|
-3.69% |
| Bitcoin (BTC) | $21.356 | -7.85% |
| Dogecoin (DOGE) |
$0.07
|
-6.81% |
| Ethereum (ETH) |
$1,704
|
-7.62% |
| Polkadot (DOT) | $7.52 | -7.05% |
| Solana (SOL) |
$37.23
|
-7.57% |
| XRP (XRP) |
$0.341
|
-7.59% |
| Altcoin Market Cap |
$602 Billion
|
-5.36% |
| Total Market Cap |
$1.01 Trillion
|
-6.39% |
Oof. It’s been a rough one today for the bulls. That being said, it’s very likely that by the time you, dear reader, read this Litepaper, some of the price levels could be wiiiiiiiiildly different from what they were at the time of writing. Just an FYI.
Taking a look at the Total Market Cap chart shows a boatload of ugliness. The past seven trading days have been one red after another. And the bleed-off has been slow until today. Pundits across the board are screaming that new all-time lows are incoming. Crypto critics are hitting Twitter with their best hindsight genius ‘HAHAHAHA TOLD YOU SO OMG LOOZERS’ commentary.
And hey, they might be right! But let’s take a look at what the technicals are doing.
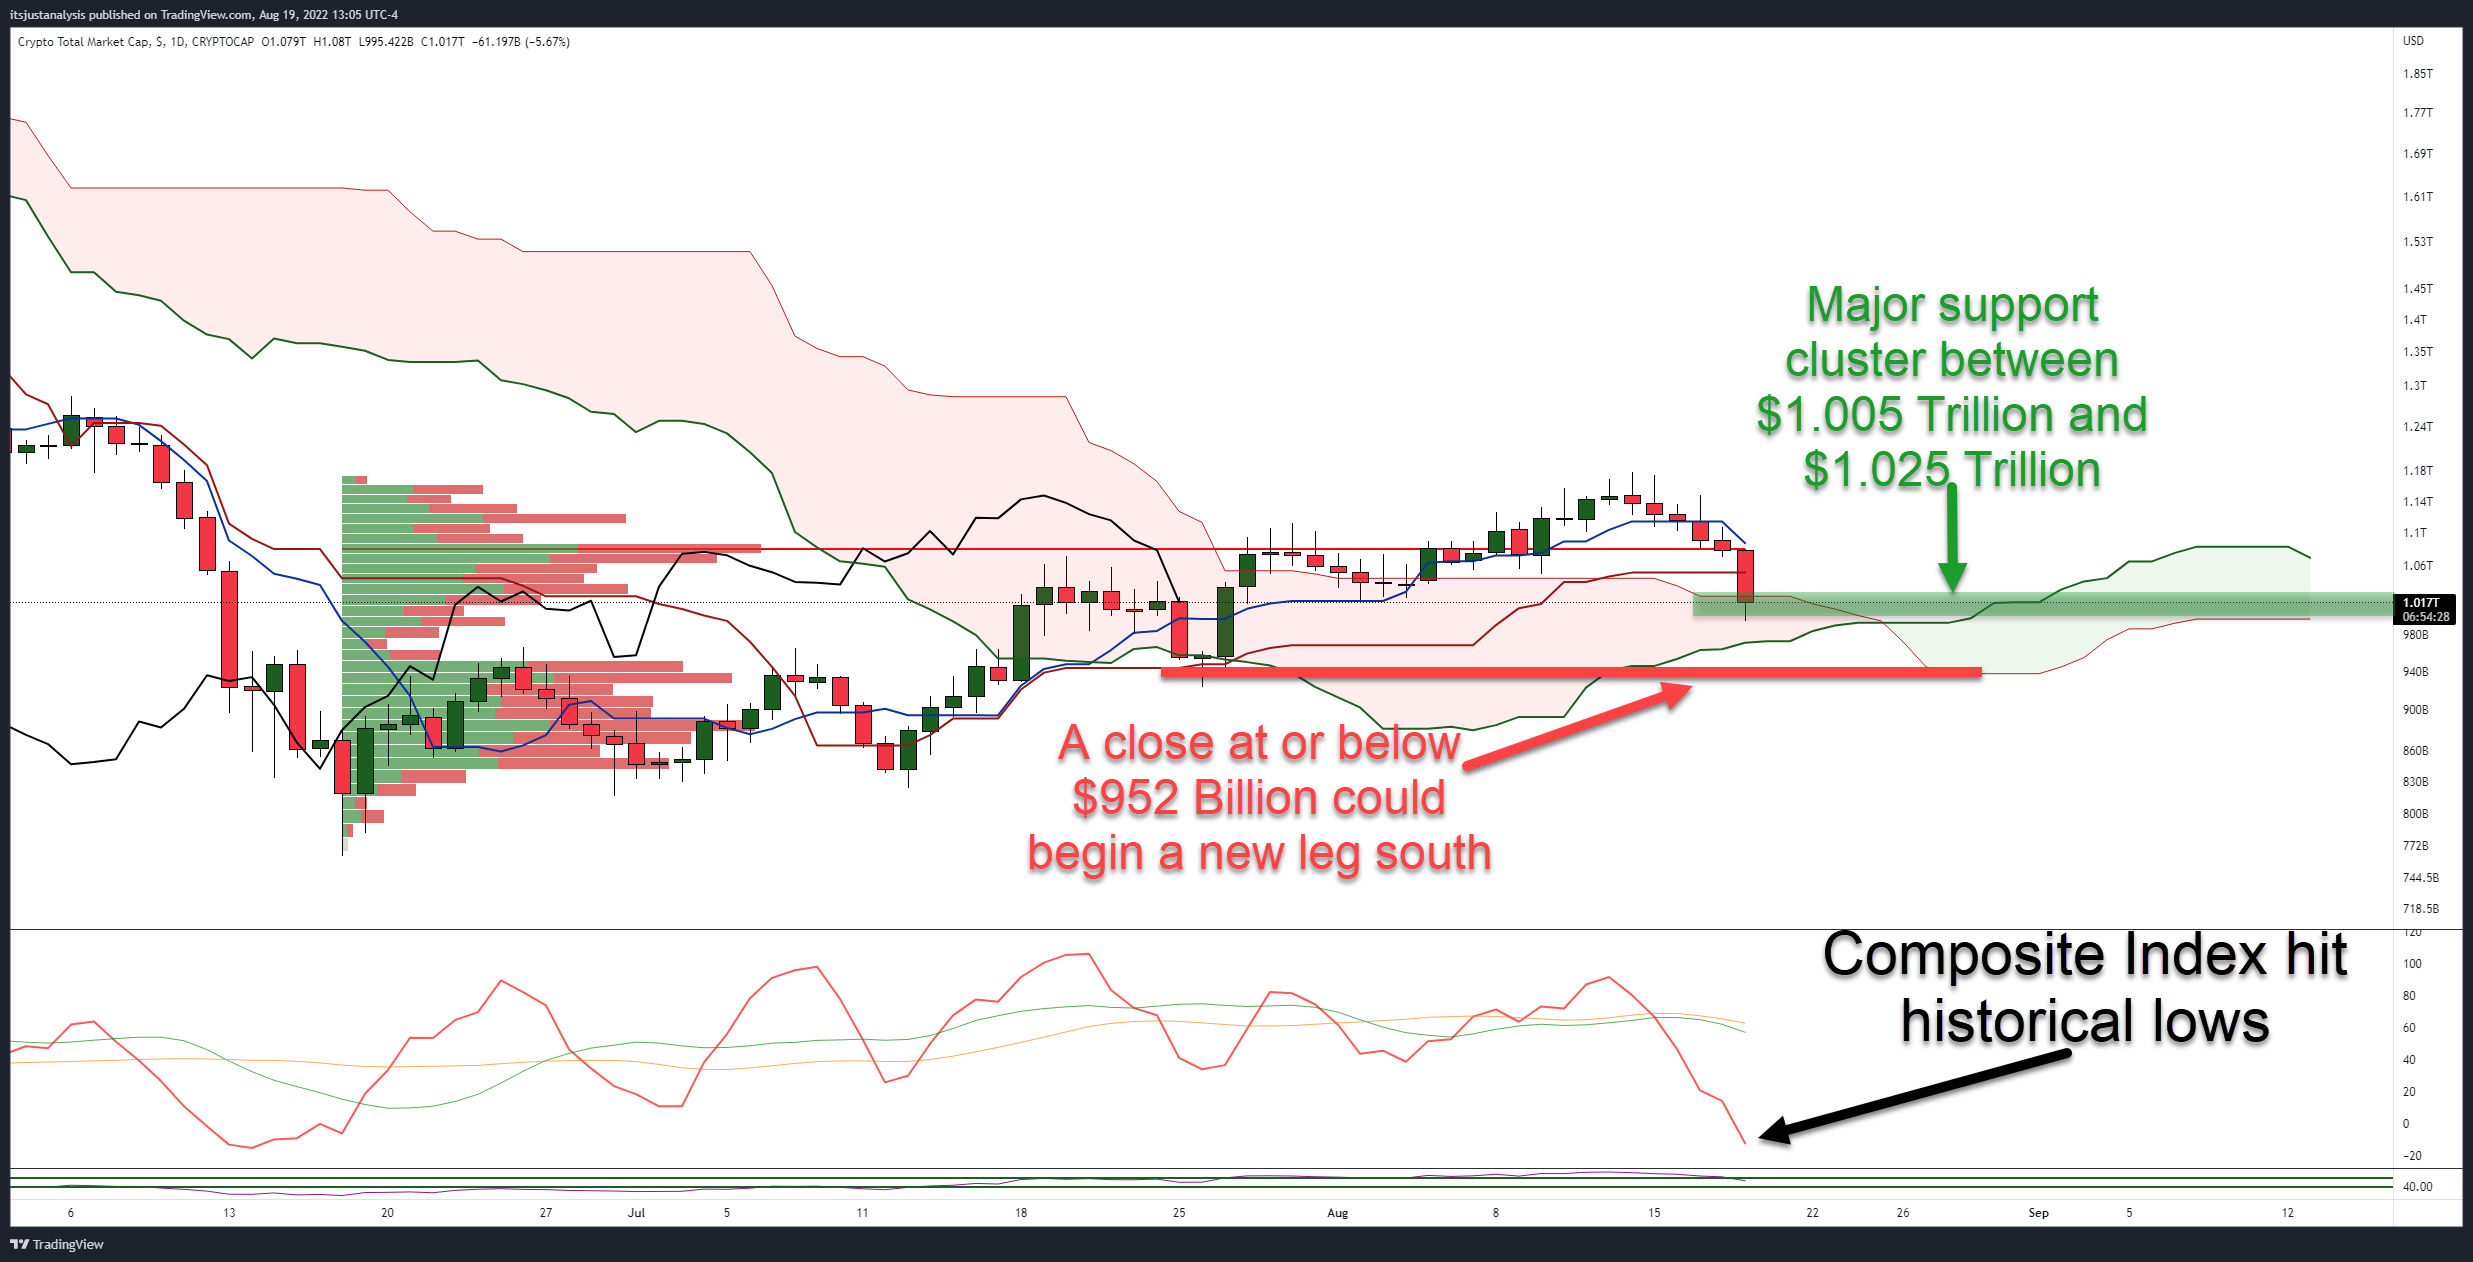
While it doesn’t look like it on the daily chart, there is a crazy amount of technical support between $1.005 and 1.025 trillion. The strongest level of support/resistance within the Ichimoku Kinko Hyo system is Senkou Span B, currently at $1.025 trillion. Just below Senkous Span B is a confluence of the 38.2% and 61.8% Fibonacci retracements near $1.005 trillion.
Pro-tip: Read our introduction to the Ichimoku Kinko Hyo system.
The Composite Index looks like a black lab puppy that broke free of its collar and is now booking it towards a flock of pigeons. While no divergence is present, the discrepancy between the slopes of the candlestick chart and the Composite Index is extreme – the Composite Index fell into historical lows, warning of major oversold conditions.
For bulls, things look bleak but most definitely oversold. Bears, on the other hand, are likely cautiously optimistic. From an Ichimoku perspective, it’s a waiting game. A clear signal that the bear market is likely returning will occur if the Total Market Cap closes below the Ichimoku Cloud, at or below $952 billion.
All in all, expect a lot of chop and whipsaws. The thresholds for the market to convert into a full-blown bull market or the resumption of the bear market are very close and likely to trap many traders and investors. 📊

Shiba Inu
After Sunday’s massive +33% spike higher, Shiba Inu ($SHIBA.X) has spent the rest of the week retracing the entirety of that movement. Will it keep moving lower, or will there be some support?
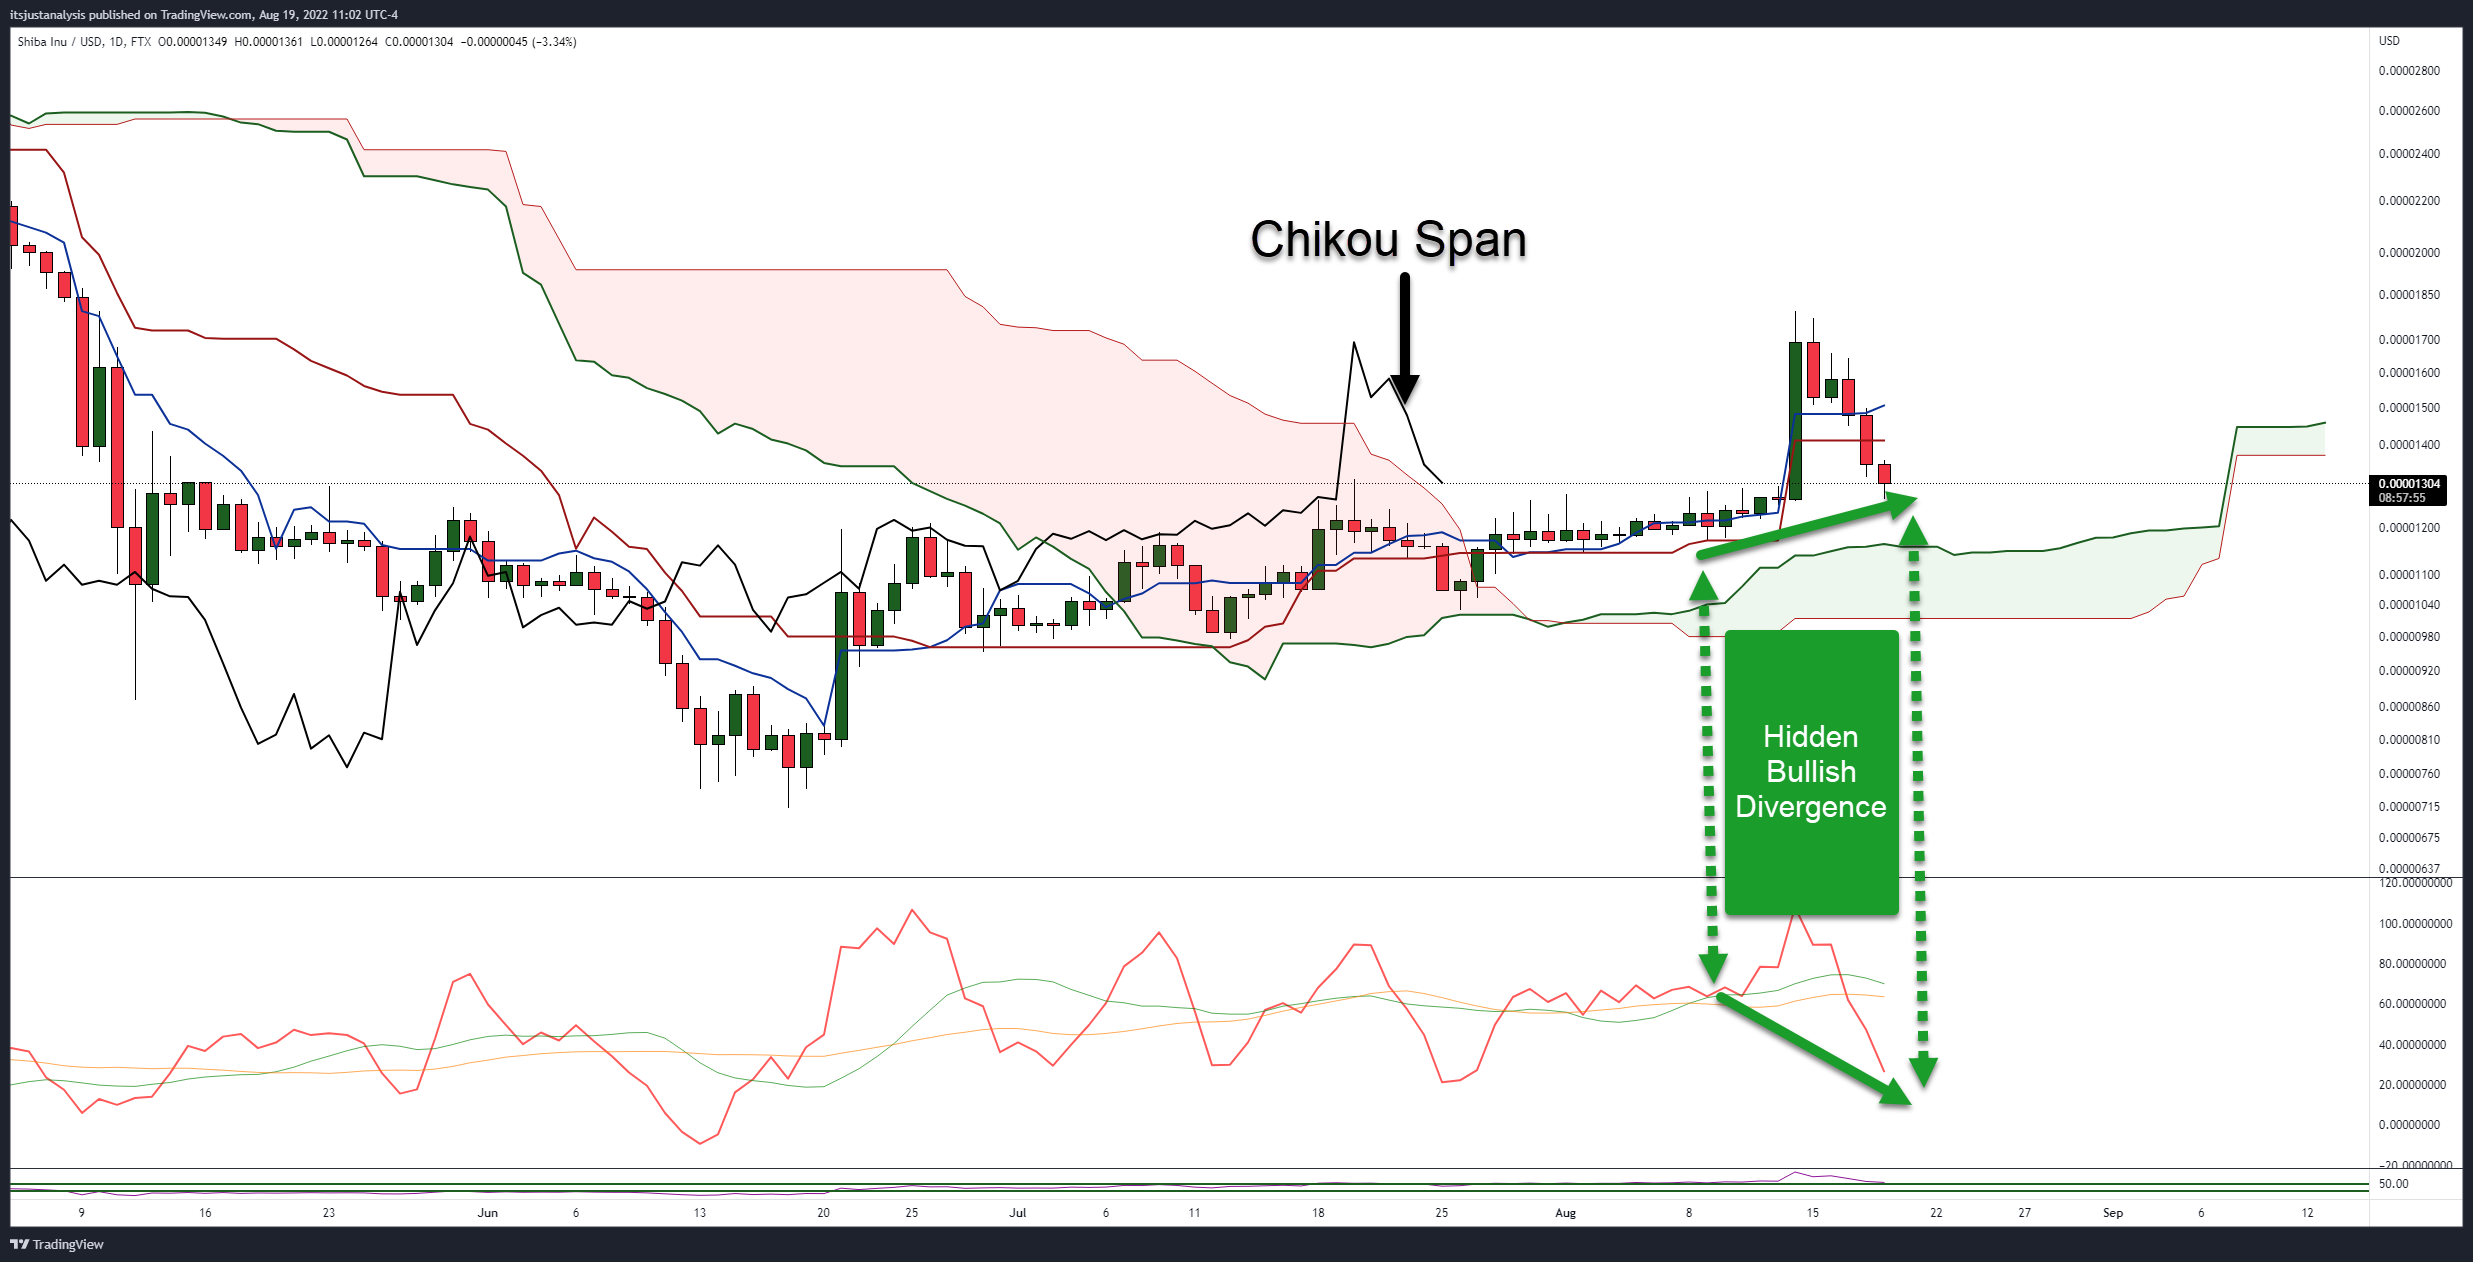
From an Ichimoku perspective, as long as Shiba remains above the Cloud, it’s still interpreted as bullish. Several other conditions on the daily chart above support a bullish thesis: The daily candlestick formation and hidden bullish divergence.
When writing this article, Shiba Inu’s daily candlestick looks like a Bullish Hammer. The bullish hammer pattern shows up at the end of a downtrend or pullback and can help analysts determine if a bounce will occur.
The second bullish condition is the Hidden Bullish Divergence between the candlestick chart and the Composite Index. Hidden bullish divergence is a condition where the candlestick chart prints higher lows, but the oscillator prints lower lows.
One more bullish condition for Shiba Inu is the location of the Chikou Span. If you read the Do You Ichimoku? Part One article, you’d know that the Chikou Span responds to the same support and resistance levels as price does.
So, while the current daily candlestick doesn’t show any near-term support within the Ichimoku system until the top of the Cloud (Senkou Span A) at $0.00001163, look where the Chikou Span and what is directly below it: Senkou Span B.
The strongest support/resistance level in the Ichimoku system, Senkou Span B, is at $0.00001265, precisely where the Chikou Span bounced off of and where the current daily low sits.
For bears/sellers, Shiba Inu’s daily chart is a waiting game. Shiba Inu would convert from a bullish Ichimoku setup to a bearish one only when there is a daily close below the Cloud, and the Chikou Span is in Open Space (read Part One of the Do you Ichimoku? article). For that to occur, Shiba Inu must close at or below $0.00001004. 🐶
Dogecoin
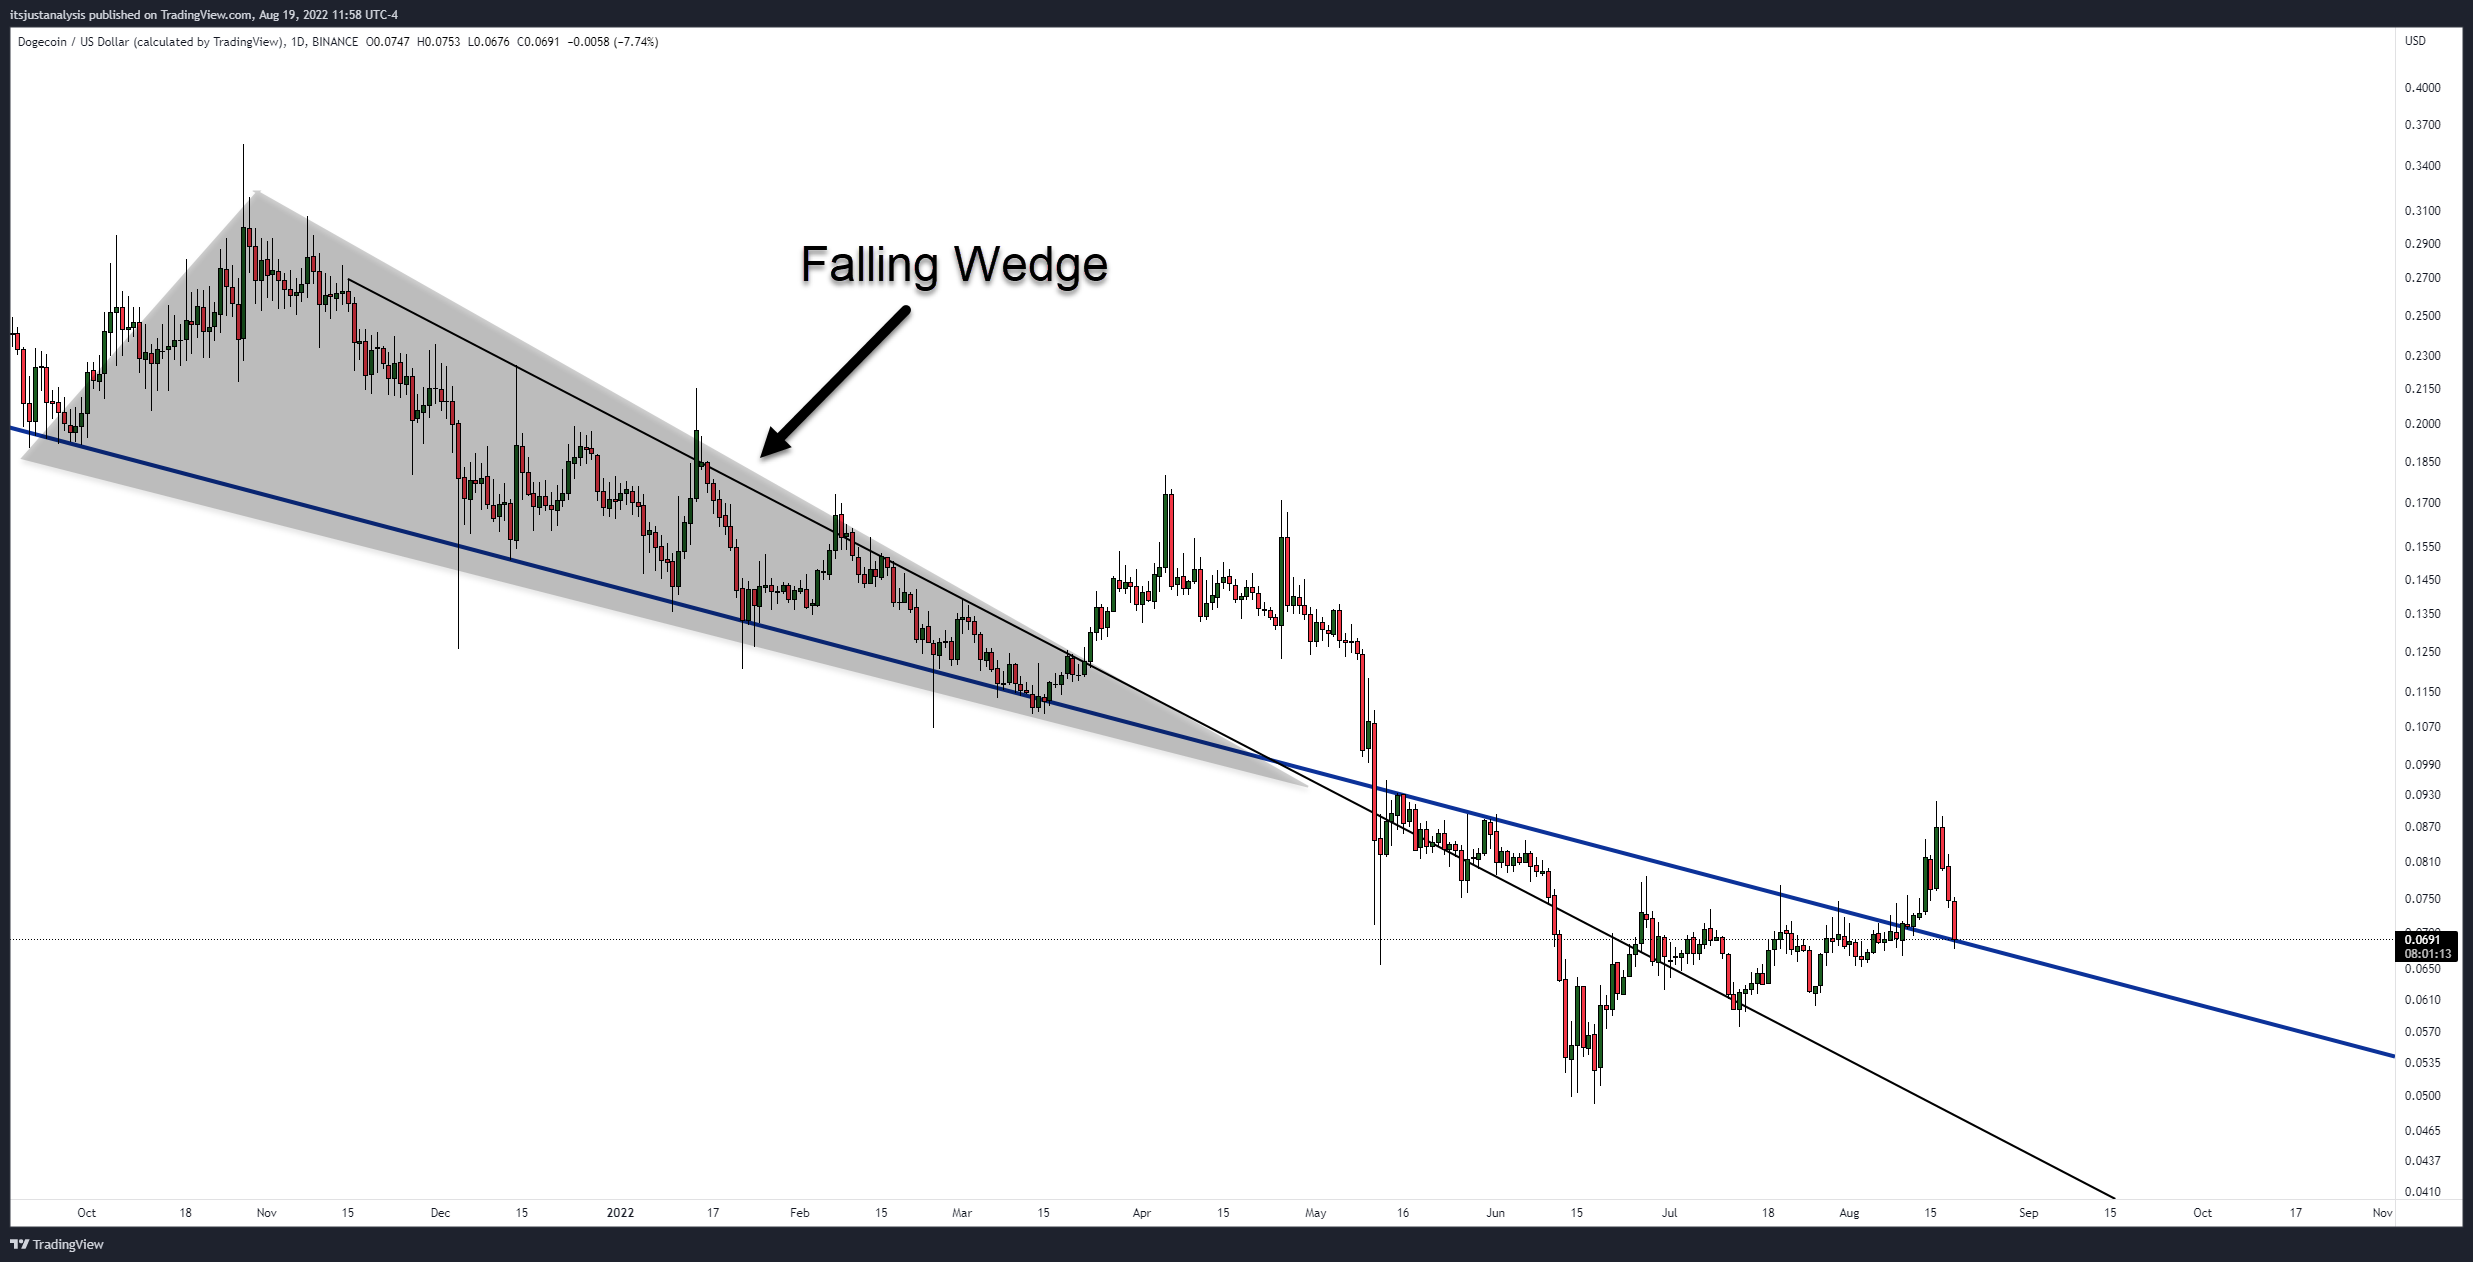
Like Shiba Inu, Dogecoin ($DOGE.X) has faced strong selling pressure over the last few days. When writing this article, Dogecoin is trading at $0.0692, or right on top of the lower trendline (blue diagonal line) of a previous falling wedge.
Pro-tip: Extend the trendlines of patterns you’ve drawn because they can often become important areas of support and resistance in the future.
Note the frequency of times the trendline had acted as resistance before bulls could breakout above it on August 12. So this begs the question: what happens now?
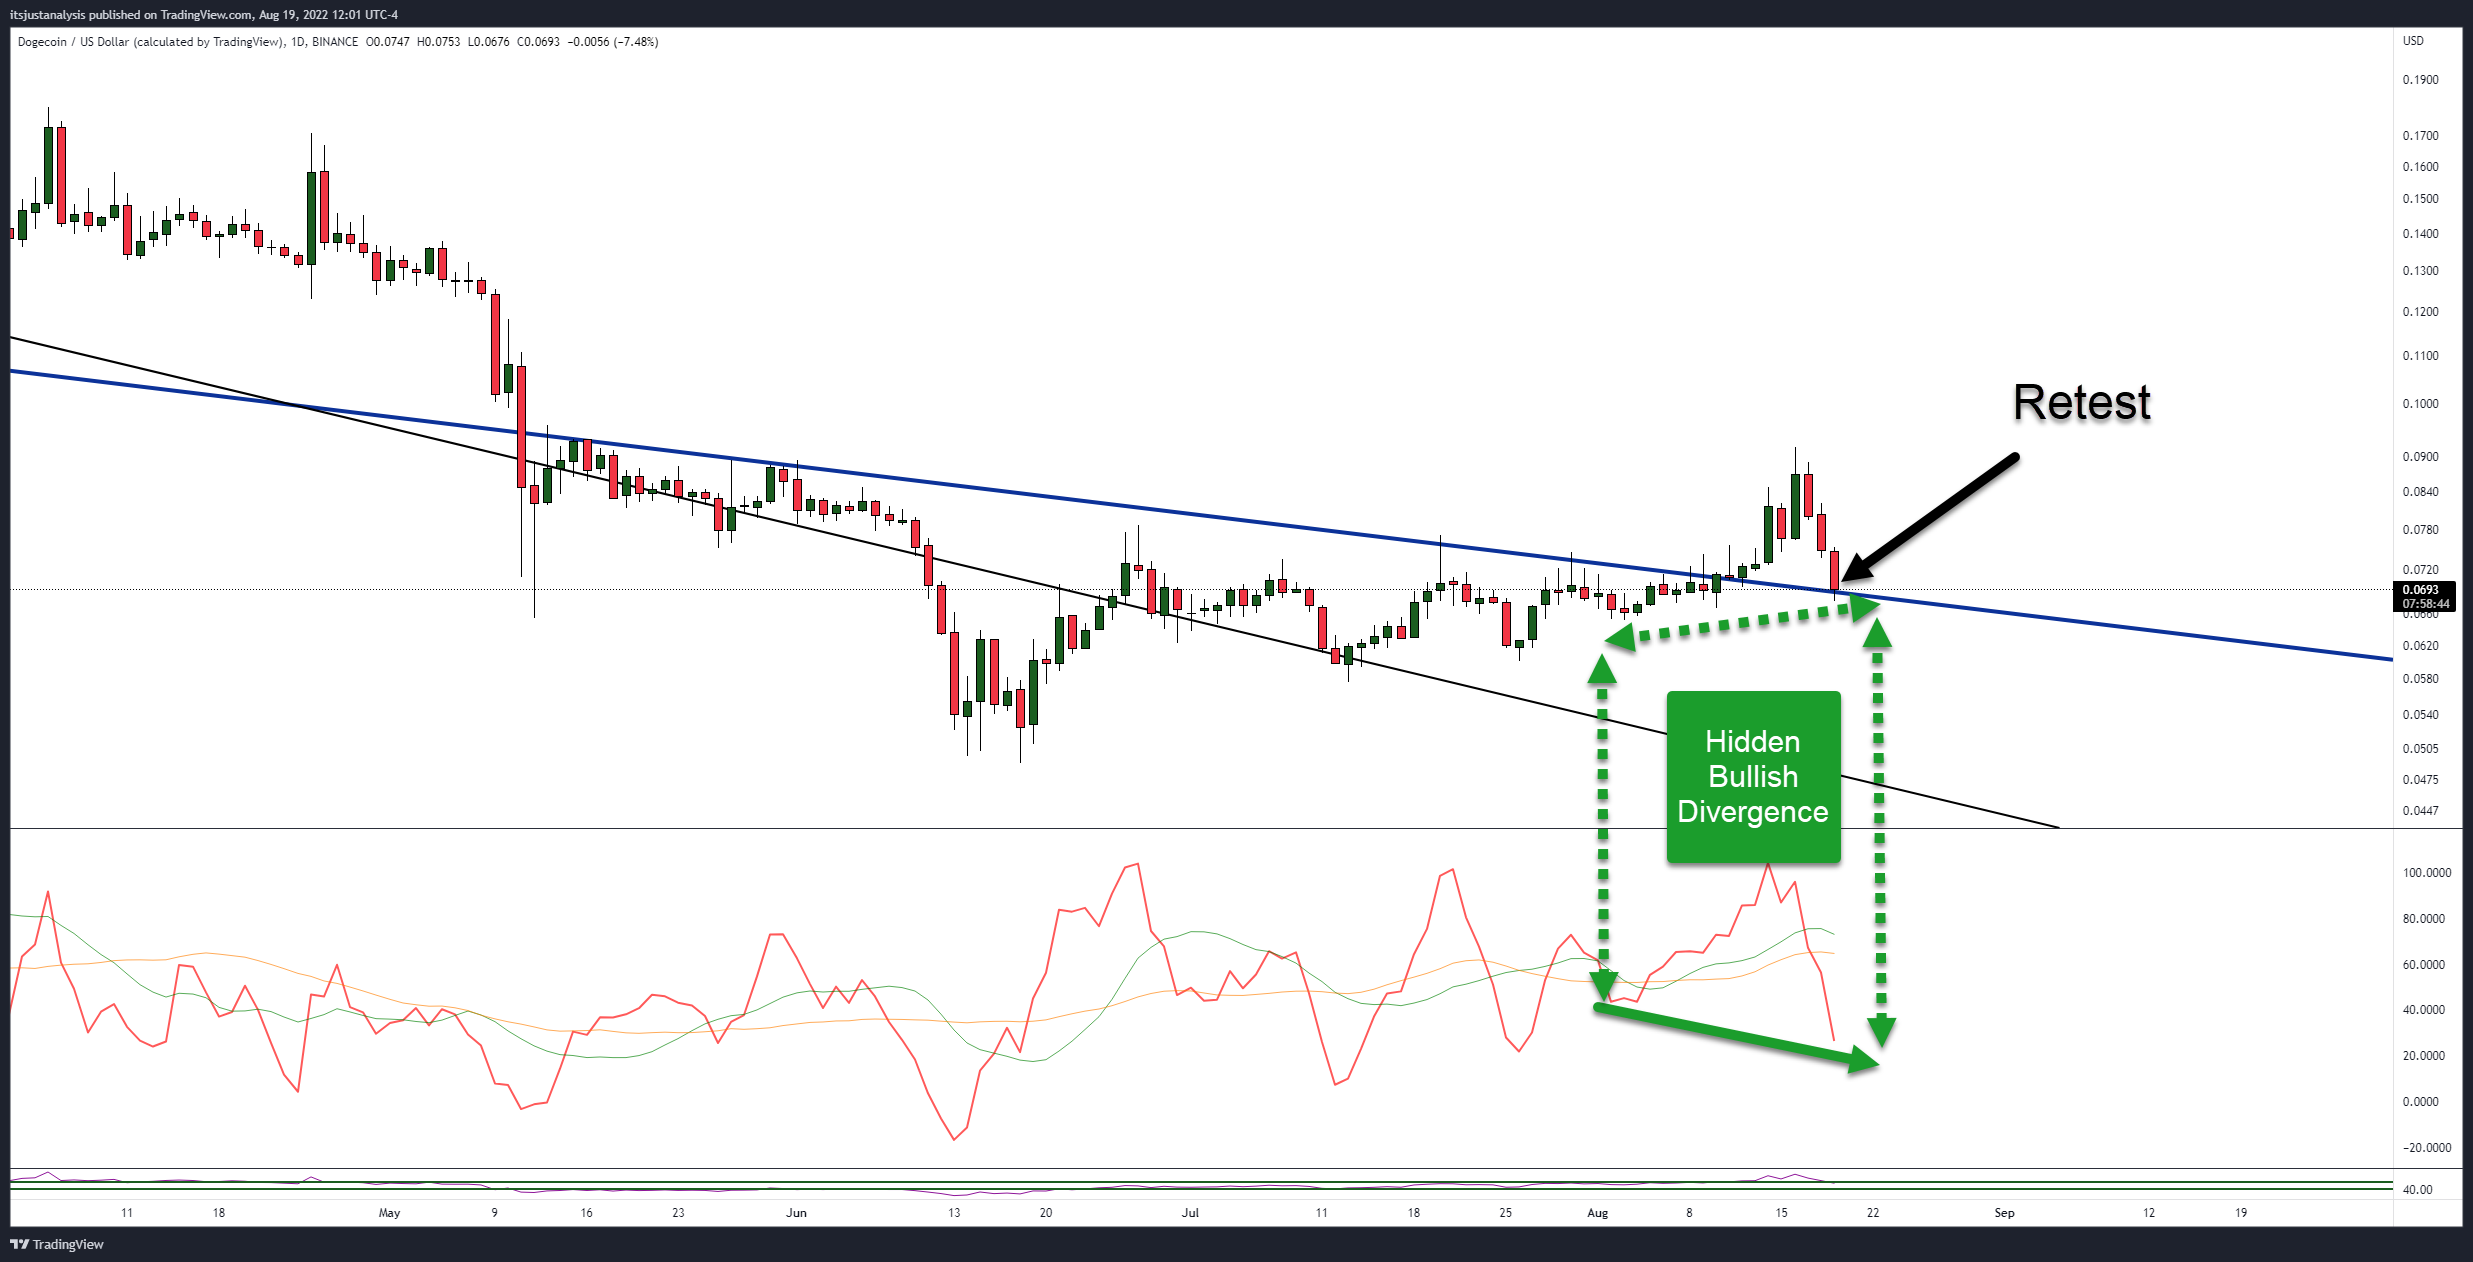
Conservative breakout traders often wait for what is known as a ‘retest.’ Retests are when price moves back to the source of resistance/support that it broke away from. Conservative breakout traders want to see the re-test hold. In Dogecoin’s case, bulls need the trendline to keep support.
Is there anything on Dogecoin’s chart that shows support will hold? The same divergence on Shiba’s chart also exists for Dogecoin’s. The combination of hidden bullish divergence and confirmed support against the trendline would give bulls hope for the end of any further downside pressure.
But not everything looks bullish – especially the candlestick pattern.
If you are a Japanese candlestick trader, then the current pattern on Dogecoin’s daily chart probably has you all sorts of giddy and excited. Why? Because one of the most powerful, bearish candlestick patterns is developing on Dogecoin’s daily chart: Three Black Crows.
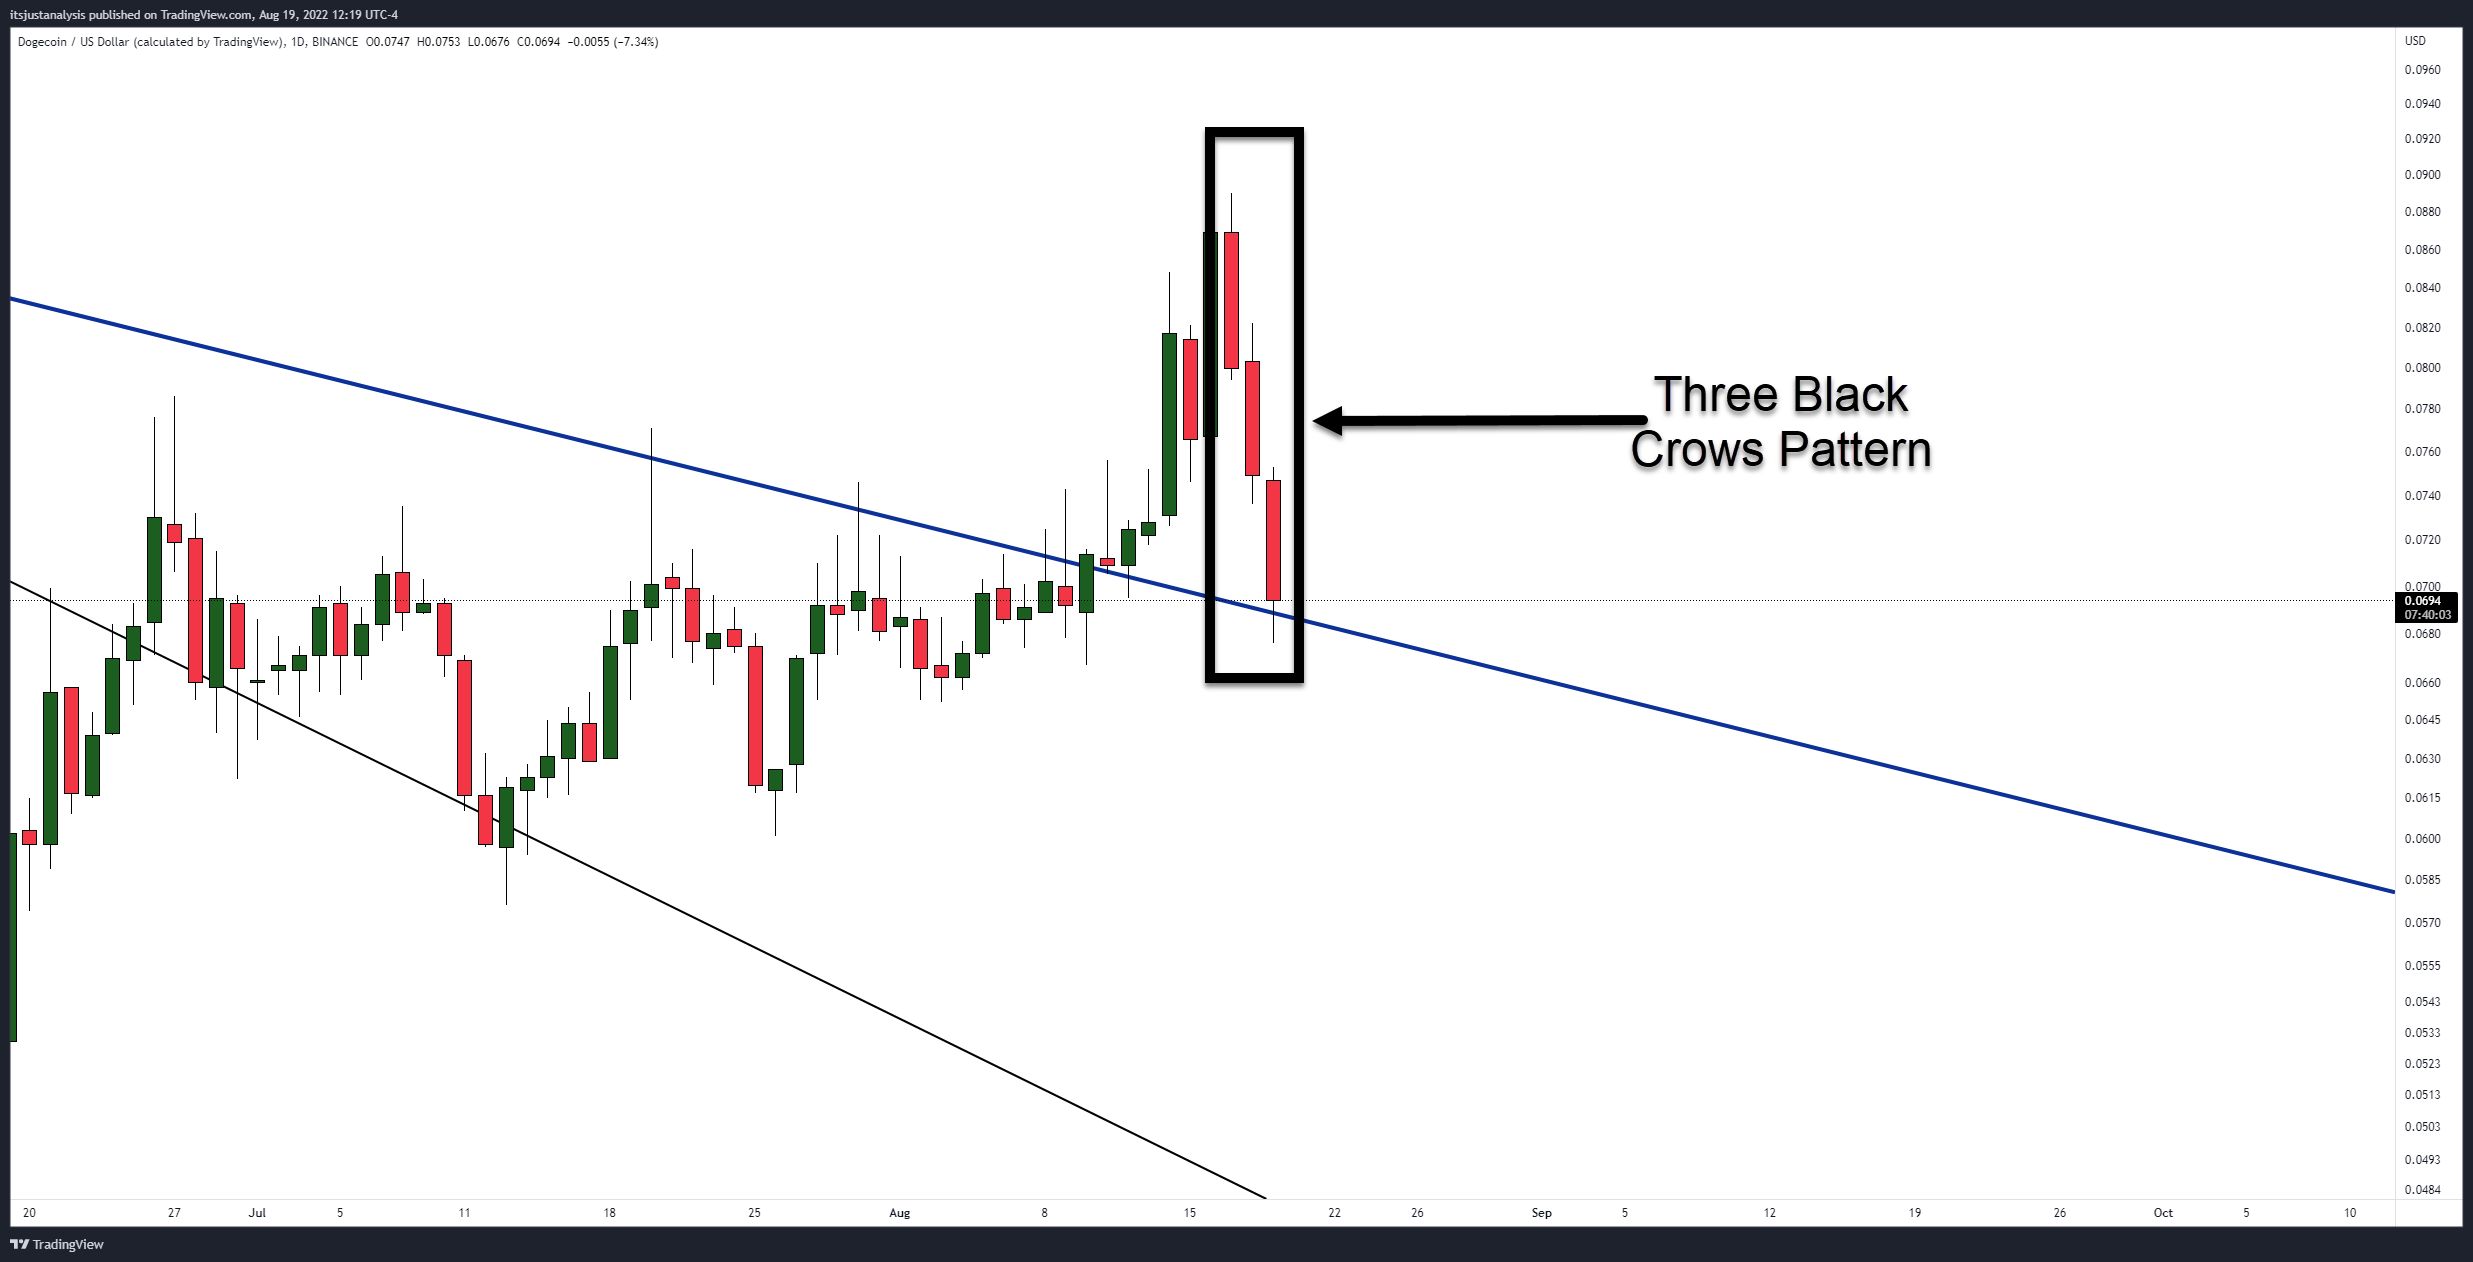
The Three Black Crows pattern is a three bar/candlestick pattern with three long-bodied candlesticks, with each candlestick close well below the prior candlestick. This pattern is interpreted as an uptrend killer – but there’s a caveat with this pattern working in the bears’ favor.
The caveat is the pattern is only statistically significant if it forms after a clear and strong uptrend. Is Dogecoin in an uptrend? From the June 18 open of $0.0527 to the most recent swing high of $0.0917 on August 16, Dogecoin rallied 74%.
Is 74% an uptrend for Dogecoin? Some would argue that it is – and some would say it’s a nothing-burger. Nevertheless, no doubt the pattern, if complete, will suck in a lot of aggressive short-traders – so conservative bears are watching where Dogecoin closes the daily.
A close above the trendline gives bulls a strong case for this move being a pullback and nothing more. But a close below the trendline could signal a failed retest and resumption of the prior bear market. 🐕
Bullets
Bullets From The Day:
🏹 Robinhood ($HOOD) has had its up and downs over the past few months. After coming off of some iffy guidance and large layoffs, they were likely looking for a win. They got one with the purchase of the crypto exchange, Ziglu – and at a 60% discount from their original offer made in April. Cointelegraph has the full story
🏈 Another big-name star has jumped on the NFT wagon. Kansas City Chiefs QB Patrick Mahomes joins Dapper Labs’ NFL ALL DAY video highlights NFT platform as their new face. More here from BeinCrypto
🔫 Ukraine continues to show how cryptocurrencies are helping them fight against Russia’s invasion of their nation. According to Ukraine’s Ministry of Digital Transformation, nearly $60 million in cryptocurrency donations has been used to support their war effort. FTX ($FTT.X) is assisting the Ukrainian government with converting crypto to fiat. See what cryptocurrencies have been donated so far
💸 Crypto analytics firm Blockdata released a report on institutional investment into blockchain and cryptocurrency companies. Blockdata reported that $6 billion had been invested between September 2021 and June 2022. Alphabet ($GOOG) and BlackRock ($BLK) are the largest investors with $1.5 billion and 1.17 billion, respectively. Read the full report here
Links
Links That Don’t Suck:
✈️ Gnosis Safe To Airdrop 50 Million Ethereum Tokens to Wallets
🌪️ Wife of arrested Tornado Cash dev forbidden to speak with him — Rally organized
🏦 The financialization of real estate is the problem, Bitcoin is the solution
🇧🇷 E-commerce Giant MercadoLibre Launches its Own Cryptocurrency MercadoCoin in Brazil
👨💻 Jump Crypto To Make Solana Validator Client Software To Enhance Performance