Welcome to the Stocktwits Crypto Data Dive for Week 1 of 2023!
If you want a detailed look at crypto’s performance in 2022, you can read it here.
This data-centric issue aims to keep track of the overall crypto market’s progress and highlight new and old trends. 🤩
The Stocktwits Crypto Data Dive serves three main purposes:
- Tracks the crypto total market cap every week.
- Tracks the 25 best-performing cryptocurrencies of the week.
- Tracks the top 10 cryptocurrencies in each of the three best-performing indices of the week. Our custom indices include “Proof of Work,” “Web 3,” “Smart Contracts,” and more!
So without further adieu, let’s get into the data from week 1:
Total Market Cap
Total Market Cap Update
What is the broader trend within the crypto market? The simplest way to track that is using a total market capitalization chart. So let’s see what we’ve got. 🔭
From the all-time market cap high of $2.834 Trillion, crypto is down -72.63%.
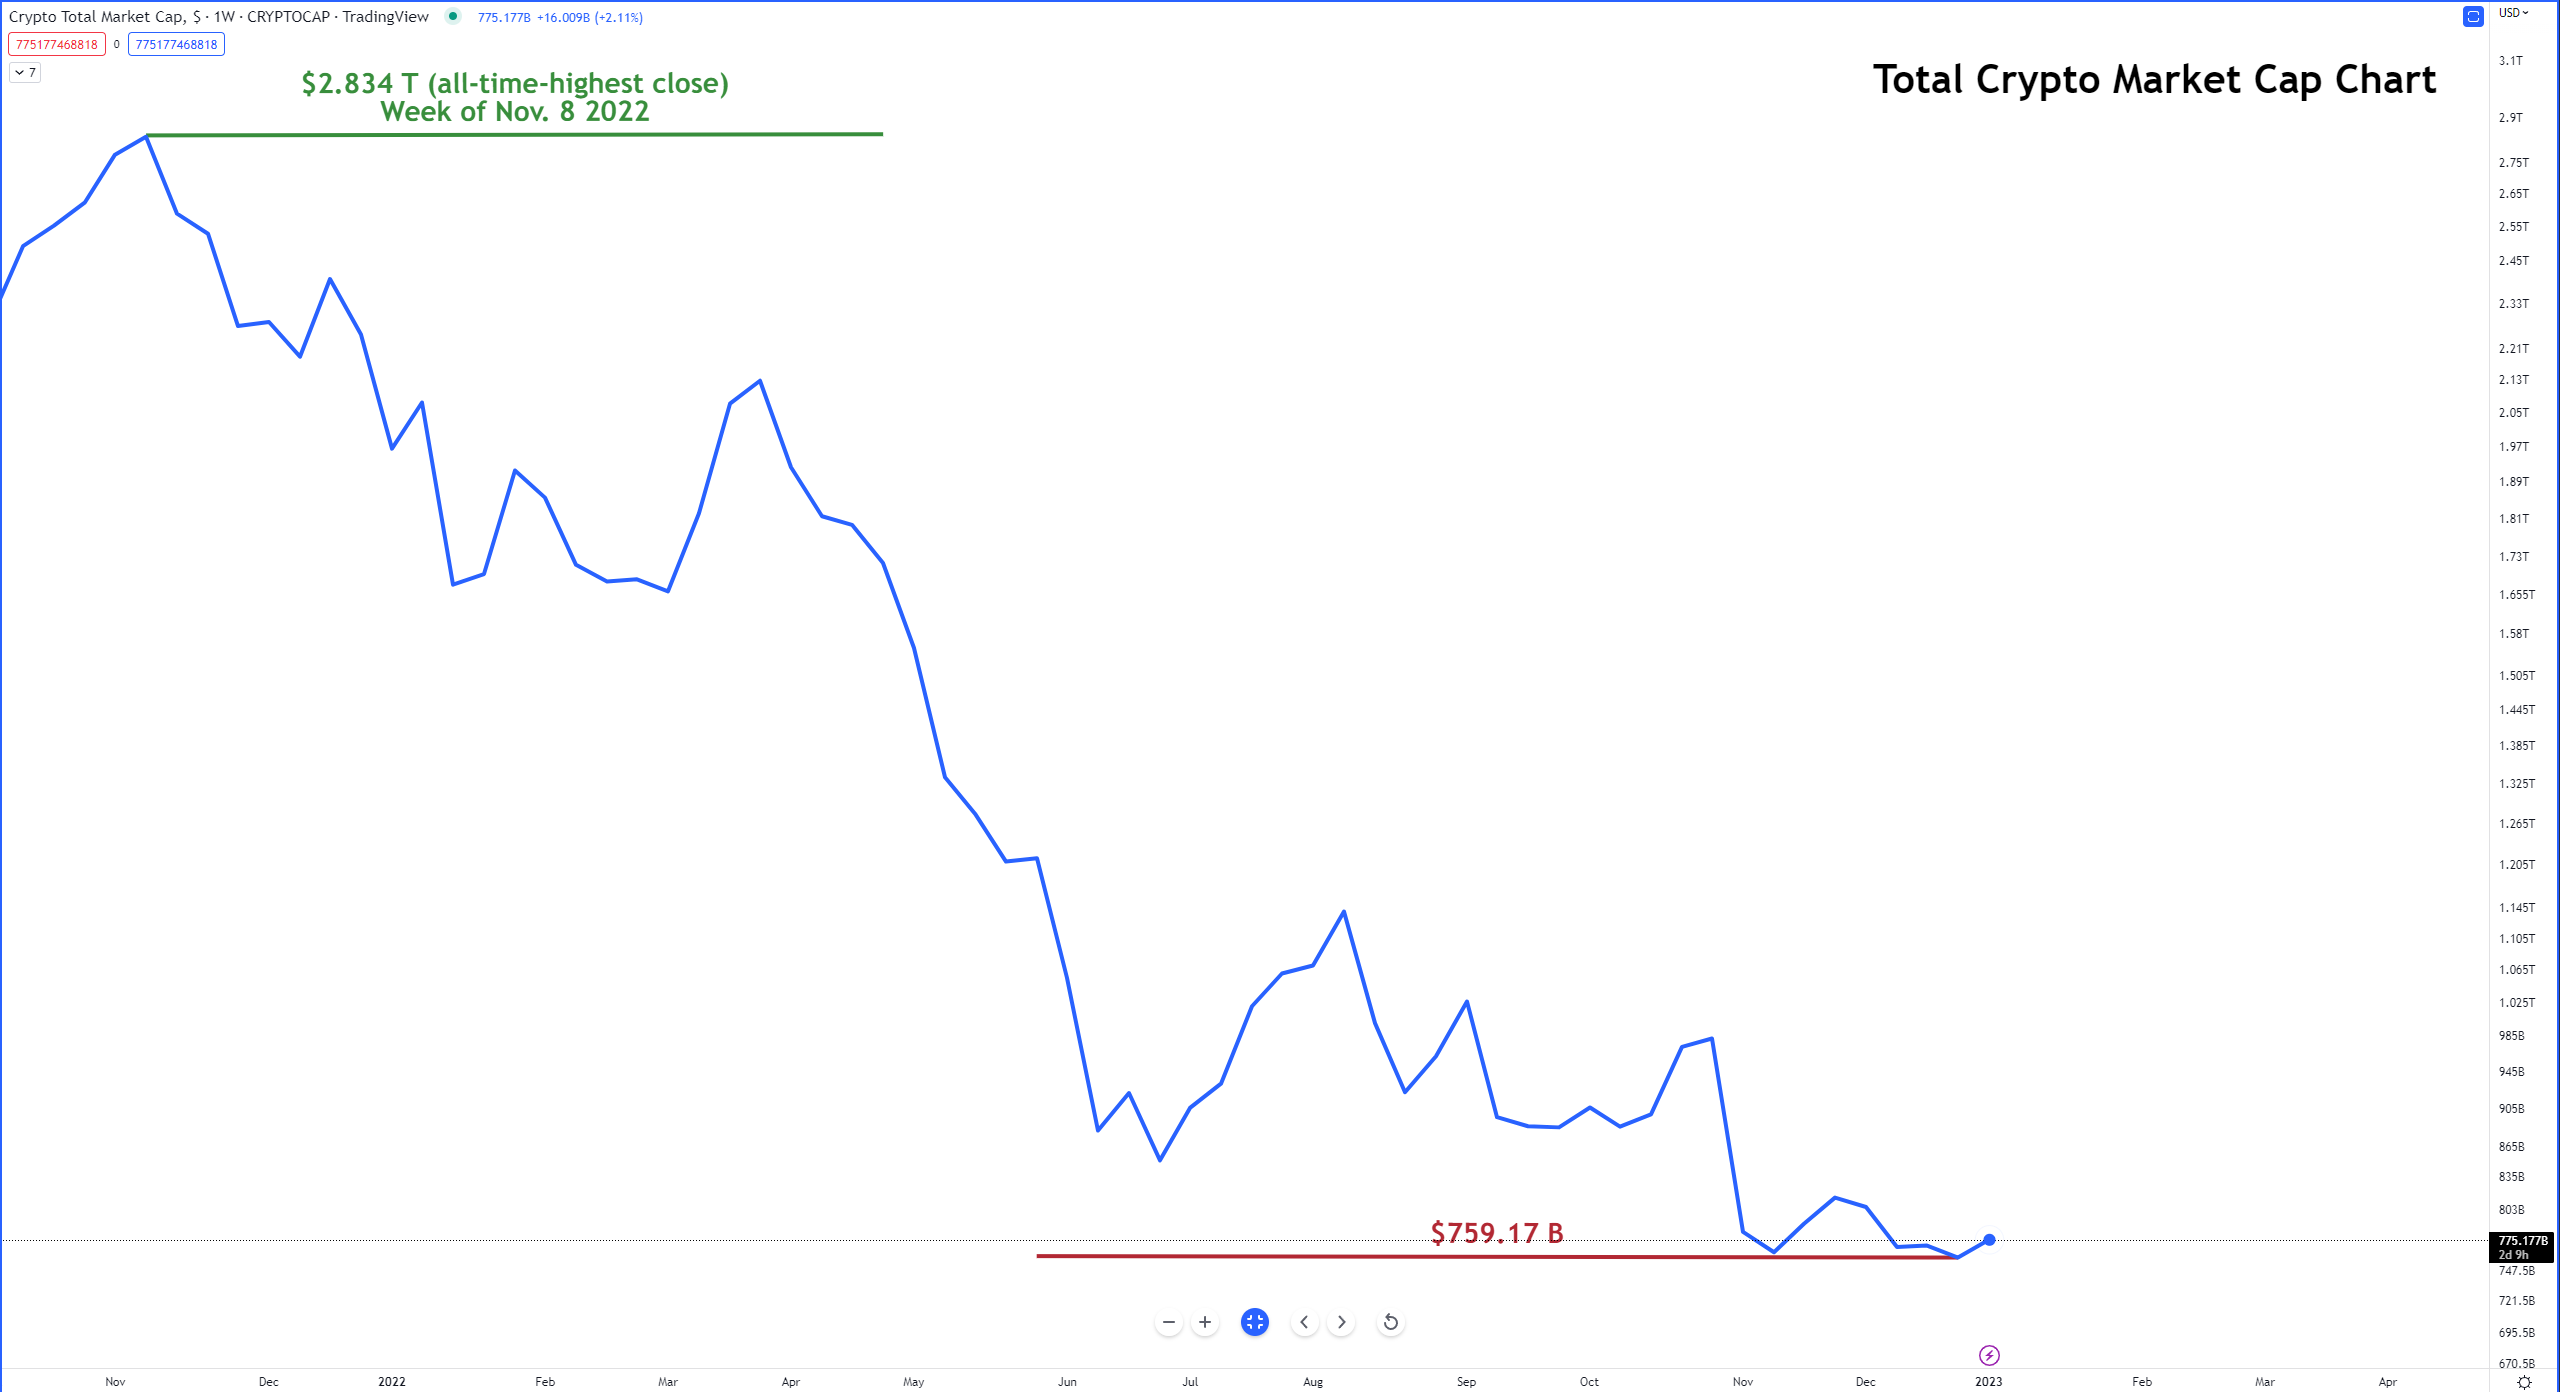
The last week in the last month of 2022 saw the Total Crypto Market Cap hit new lows – but there’s a small bounce going on this week, up +2.12% from last week.
Analyst expectations are mixed for what Q1 of 2023 may look like. Still, there is growing hope amongst crypto participants on the Stocktwits app that traders and investors expect a bullish correction to occur. 🕵️♀️
Top 25 Cryptocurrencies
Top 25 Cryptocurrency Update
There was one major change this week and an interesting one at that.
$SOL.X was recently given the boot over the past few weeks, losing so in market cap that it didn’t even make the screening criteria, but it’s back in the Top 25 and the best performer of the week.
And the best performer of 2022, $TRX.X, replaced by Solana, didn’t make it into the Top 25 this week.
Overall, the Top 25 cryptocurrencies were positive for the week, higher by +3.2%. 👍
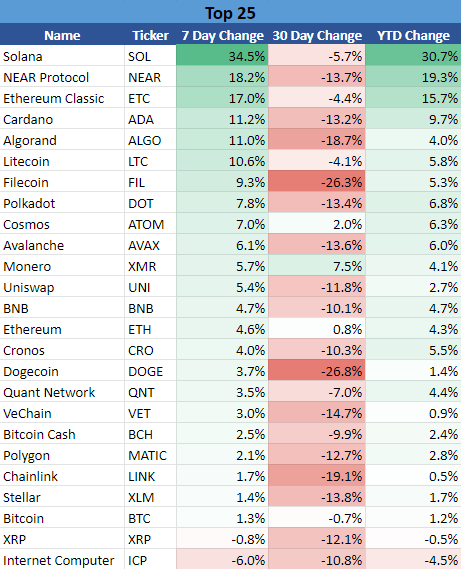
*The universe used to construct the Top 25 list consists of all cryptocurrencies with at least $1 billion market caps, excluding stablecoins.
Stocktwits Crypto Index RRG
Stocktwits Crypto Index RRG
Relative Rotation Graphs (RRG) are useful visual tools to identify how an instrument or a sector performs against a benchmark. The RRG image below shows eleven customized crypto indices. Each contains the top ten by market cap (excluding stablecoins and some exchange-based tokens).
They are rebalanced monthly, and the RRG tracks the last seven days’ performance.
Without going into the nitty-gritty details, the four colored sectors can be thought of like this, so imagine you’re in a race:
- Leading Quadrant (green) – You are in 1st, 2nd, or 3rd place. You are leading the pack. You’re going to medal. Anthems will be sung, tears will fall, and you may or may not pass a doping test.
- Weakening Quadrant (yellow) – You’re losing your momentum and out of breath. You just realized that your spouse or your mom didn’t show up to watch you, sapping your enthusiasm. You’re falling back and in the middle of the pack.
- Lagging Quadrant (red) – You pulled a hamstring. You pulled a Michael Scott and ate five pounds of fettuccine alfredo an hour before your race. You fell down. You’re dead last. No anthems will be sung, but tears will fall, and no one will remember your name.
- Improving Quadrant (blue) – You see your spouse or your mom in the stands. The crowd starts to see you get up. Emotional music begins, and the camera pans to the crowd in slow motion. You’re back on your feet and in the middle of the pack, gaining on the leaders.
The last week of 2022 was an ugly one. The Metaverse, Web3, and DeFi indices all fell into the Lagging quadrant, with only the Privacy and Proo-Of-Work indices remaining outside of it – but barely.
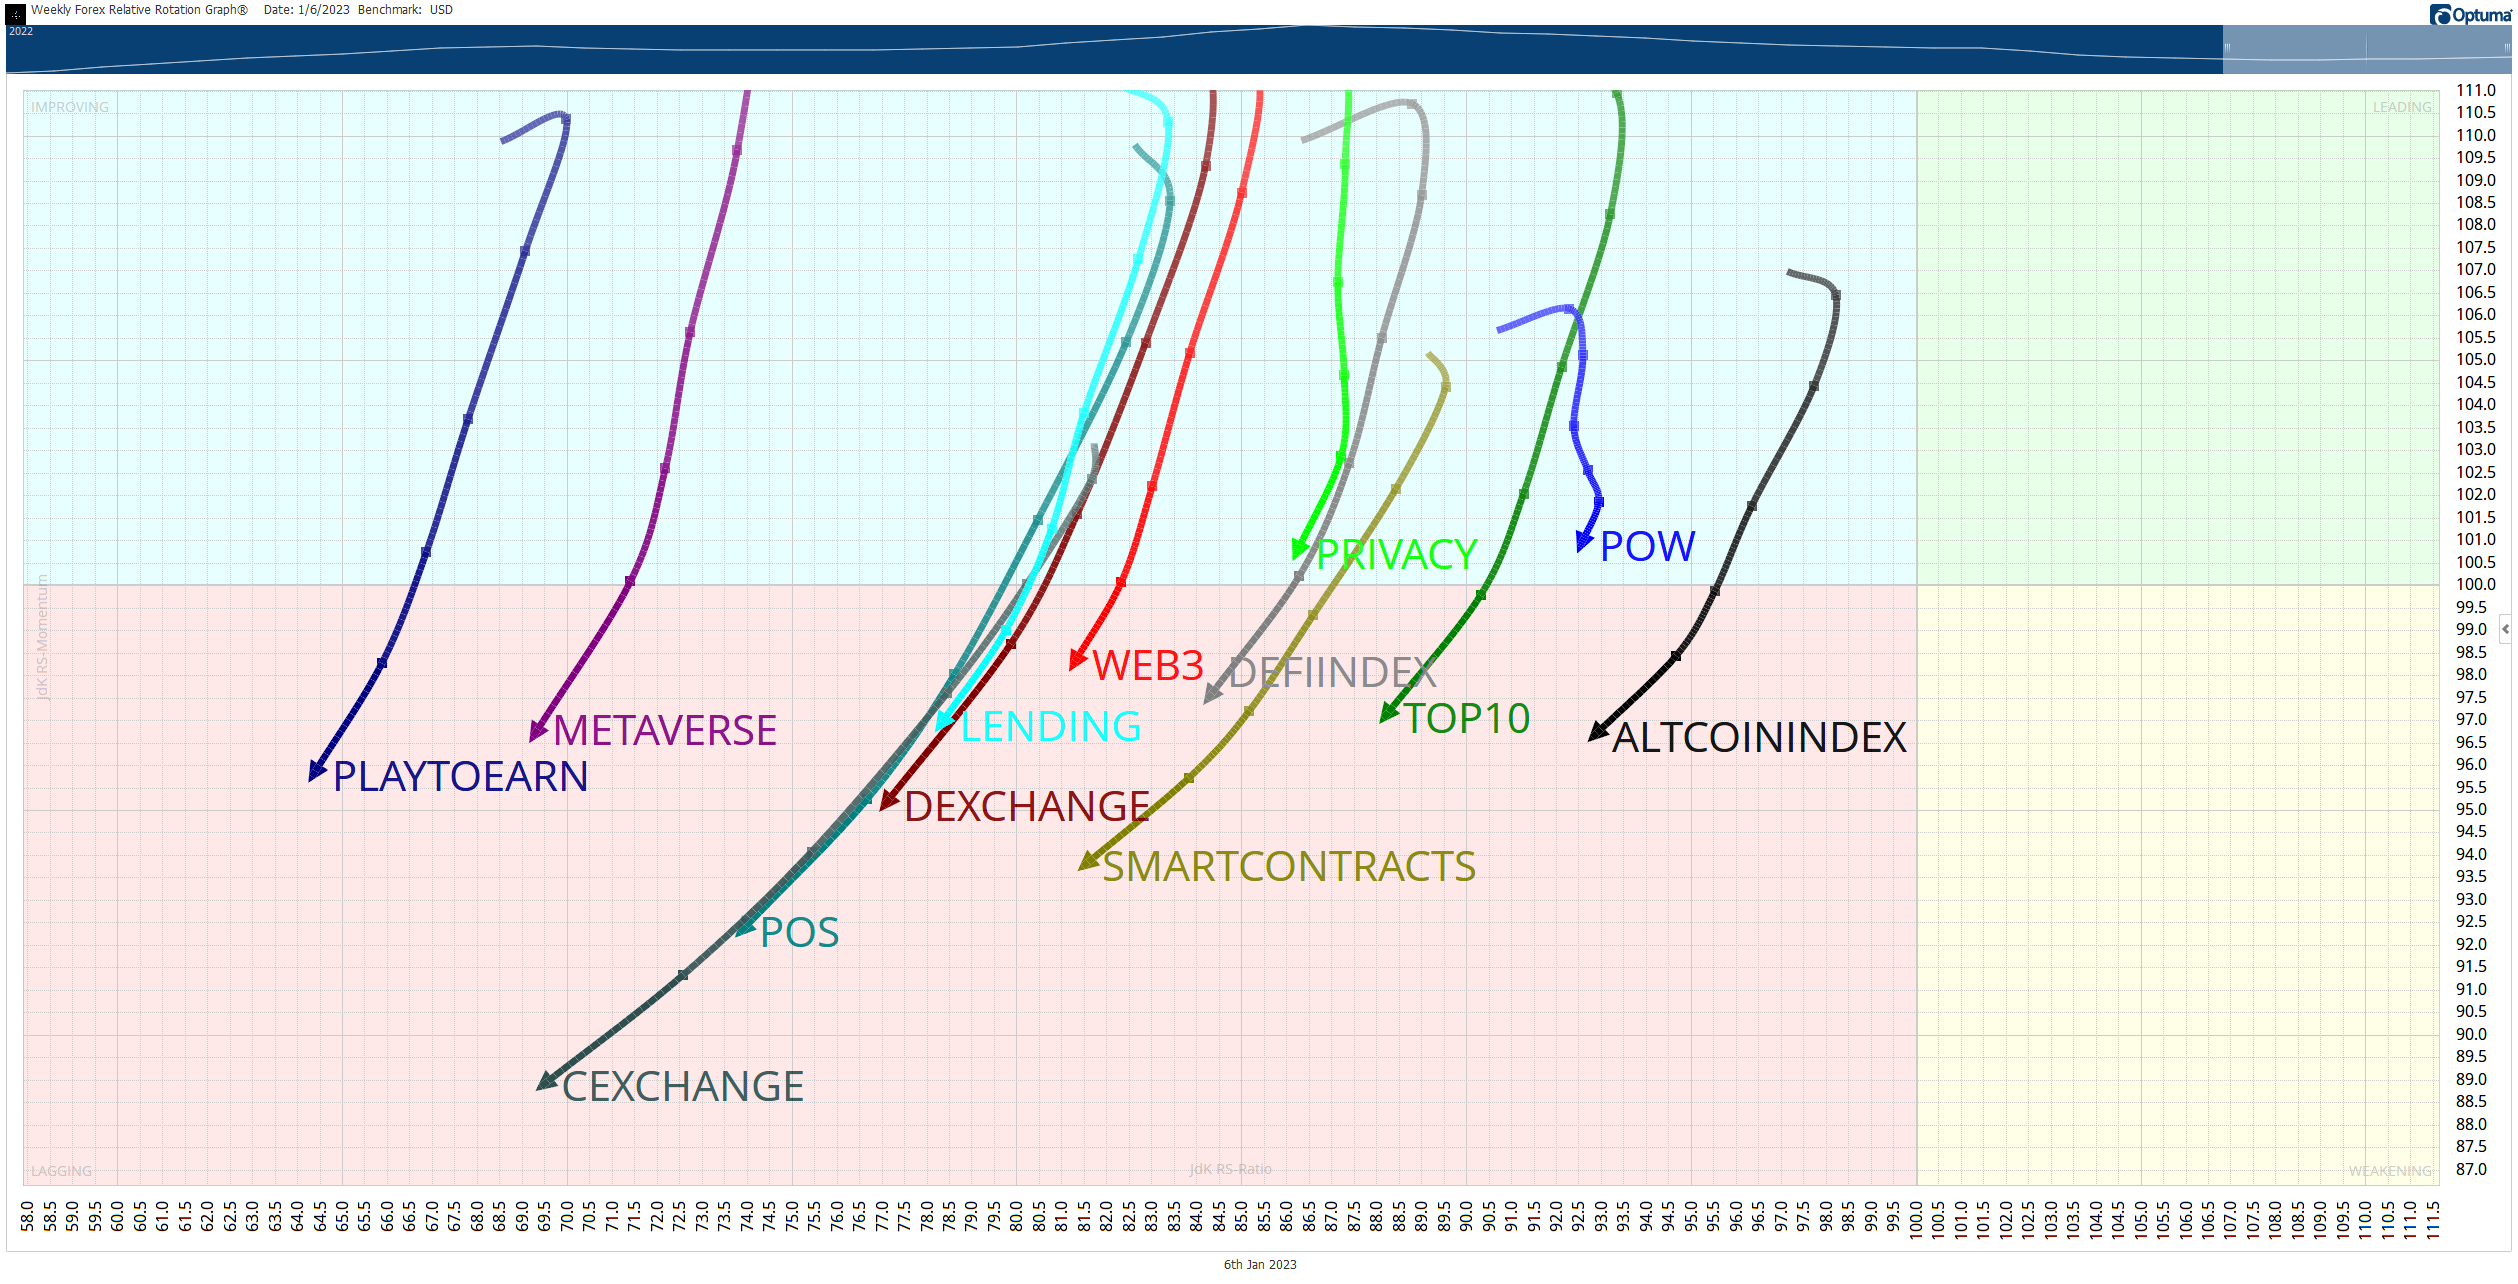
However, suppose next week sees a continuation of this week’s mildly bullish momentum and participation. In that case, we’ll likely see the RRG start to improve, especially in the Proof-Of-Stake, Smart Contracts, and Metaverse indices.
The GIF below shows the past seven weeks of movement on the RRG.
Proof-Of-Stake
The Proof-Of-Stake Index
The Proof-of-Stake Index includes any cryptocurrency that has a Proof-of-Stake consensus mechanism.
We construct this index by limiting the assets in this space to a minimum market cap of $100 million.
This week, there was one major change, with $WAVES.X replacing $CELO.X.
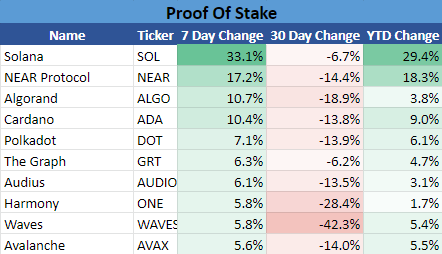
The Proof-Of-Stake Index was the week’s best performer, up 9.7%. 🏆
NFT
The NFT Index
The NFT Index is made up of cryptocurrencies that offer non-fungible tokens.
We construct this index by limiting the assets in this space to a minimum market cap of $50 million.
No major changes within this index this week.
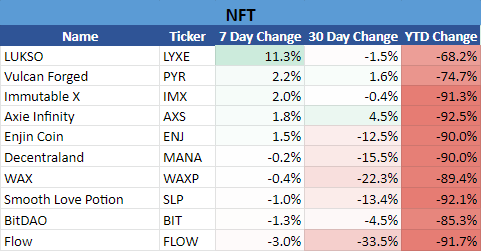
The NFT Index was the second best-performing index of the week, up +8.50%. 💪
Metaverse
The Metaverse Index
The Metaverse Index is a collection of cryptocurrencies that focuses on virtual worlds and environments, including the Play 2 Earn and gaming class of cryptocurrencies.
We construct this index by limiting the assets in this space to a minimum market cap of $10 million.
There were two major changes this week.
$AXS.X and DVI replaced GF and $MC.X.
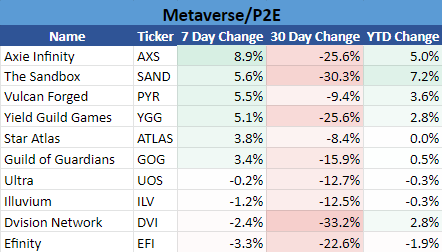
The Metaverse Index was the third best-performing index, up +5.6% for the week. 3️⃣
Bonus Index - Proof-Of-Work
The Proof-Of-Work Index
The Proof-Of-Work Index is a collection of cryptocurrencies that, you guessed it, are blockchains that use Proof-Of-Work as their primary consensus mechanism. Bitcoin is the most well-known and biggest Proof-Of-Work cryptocurrency.
We construct this index by limiting the assets in this space to a minimum market cap of $100 million.
There are some major changes week over week in this index, with half of the list getting replaced.
$AMP.X, $BCH.X, $BSV.X, $BTC.X, and $ZEN.X replaced by $BTG.X, $DOGE.X, $ETC.X, $LTC.X, and $RVN.X.
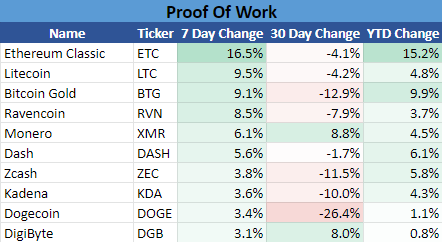
The Proof-of-Work Index was the worst performer of the week, up +1.6%. 🟥
Summary
Putting It All Together
This week’s performance is almost a complete 180-degree turn from what the 2022 yearly performance of these indices looked like.
For 2022’s performance, the Proof-of-Stake Index was #8, NFT #9, and Metaverse #10.
The second-best performing index of 2022, Proof-Of-Work, was this week’s worst performer.
Again, if you didn’t get a chance to see how our custom crypto indices performed in 2022, you can read it here.
10 out of 10 indices closed in the green this week. 💚
See You Next Saturday!

Credits & Feedback
Today’s Litepaper was written by Jon Morgan. Let him know how he did: