When stocks are on the move, either up or down significantly, traders often turn to technical analysis for answers. 📈 📉
In this article, we want to review a chart that highlights several key concepts.
The chart in focus is the Russell 2000 $IWM, the most widely-followed U.S. small-cap stock index.
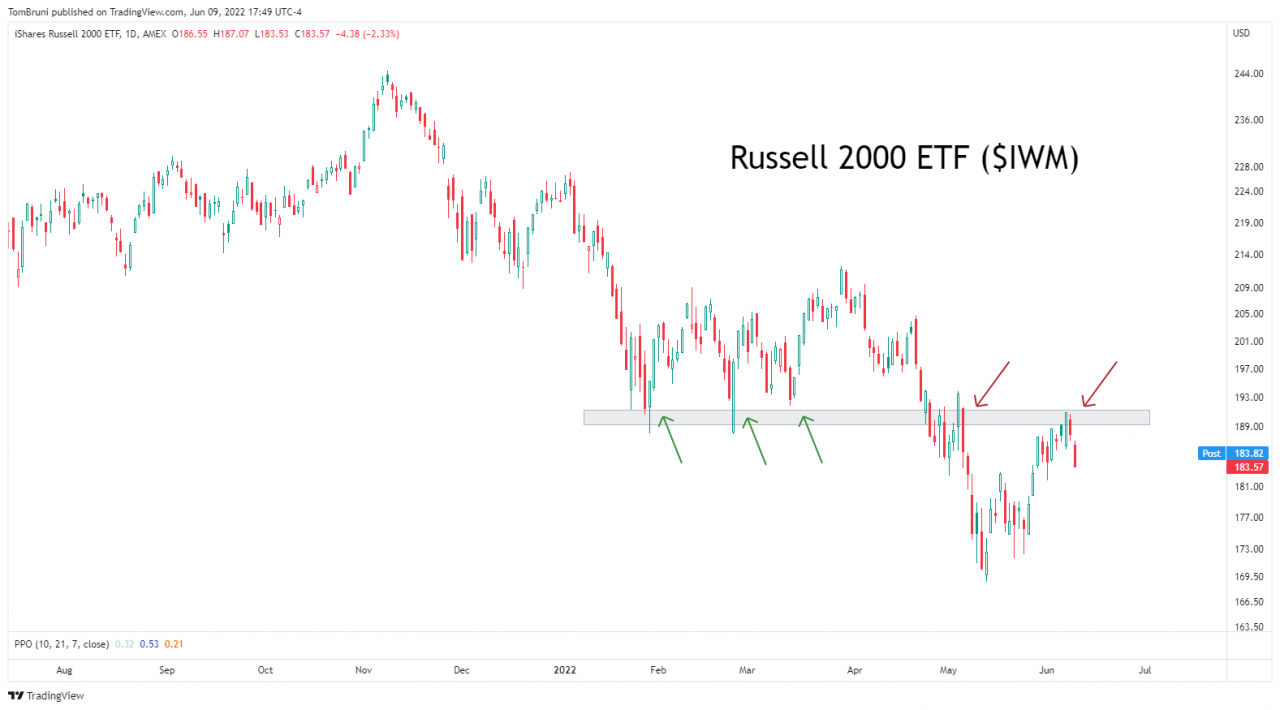
The above chart highlights a few key concepts:
- The first is polarity, which suggests that former support levels will turn into resistance — and vice versa.
- Look how buyers stepped in to defend the 189-192 level throughout the year, but sellers used that level to get aggressive once it broke in April.
- The second concept is trend. Now there are many ways to measure price trends, including smoothing mechanisms like moving averages and indicators like the ADX, but the easiest way is to just look at prices. 💰
- A series of higher lows and higher highs is an uptrend. Conversely, a series of lower highs and lower lows is a downtrend.
- Since prices peaked in November and made a lower low in December, there have been a series of lower highs and lower lows. In other words, we’re still in a downtrend.
- Lastly is a concept called risk appetite. Generally, when portfolio managers are optimistic about the stock market and want more beta in their portfolio, they’ll reach for riskier small-cap stocks instead of large and mega-cap stocks. 😋
- So the fact that small-cap stocks are in a downtrend could be a confirming signal that risk appetite isn’t all that strong right now.
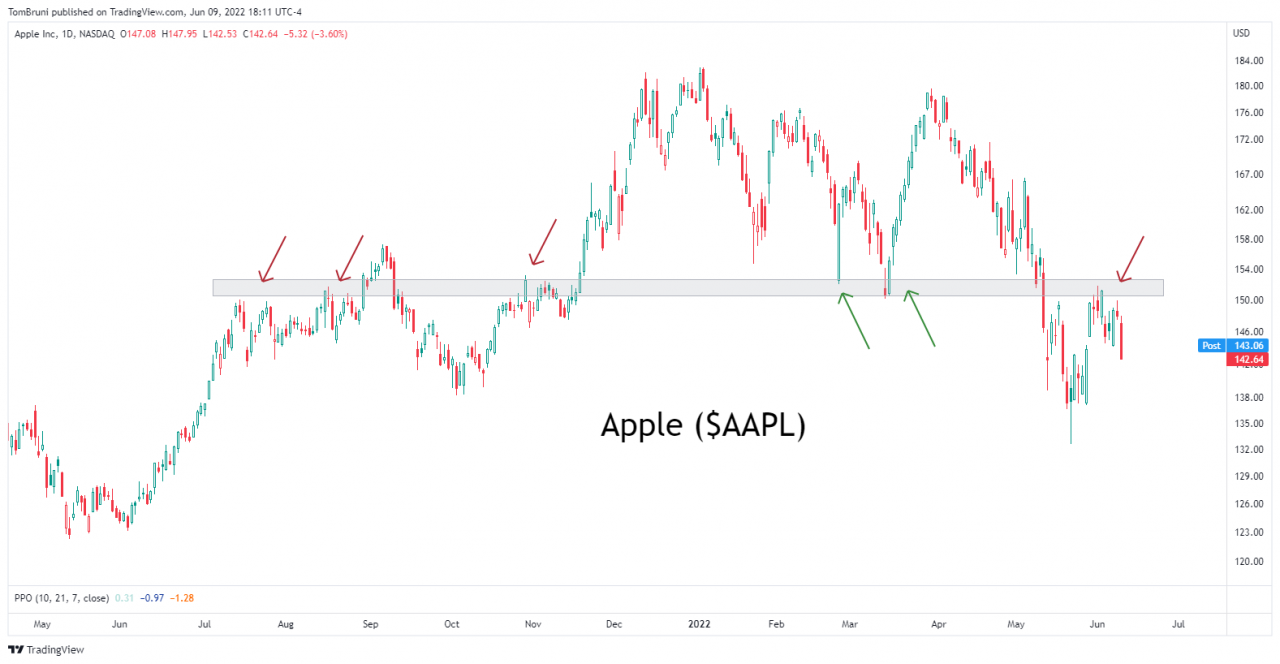
These concepts are in focus because many major stock indexes and individual stocks currently exhibit similar characteristics.
Here’s another example of Apple.
We hope this technical analysis crash course has helped prepare you for the many charts you’ll likely see in the days/weeks ahead. ⏳