The Chart Heard ‘Round Wall Street

The rally over the last two days has gotten a lot of people excited on Wall Street, specifically some technical analysts. 👀

The reason is that there was an improvement in the “breadth” of the market.

Market breadth analysis measures the health of the stocks that comprise the overall market indexes. The S&P 500 is a market-cap-weighted index, so breadth analysis looks to understand how well (or poorly) the 500 stocks within it are performing. 🔍

One of the most commonly used measures is the New Highs – New Lows Percentage Index. When the index we’re analyzing is in an uptrend or bull market, we generally want to see more stocks making new highs than new lows. However, in typically see the opposite in a bear market: more stocks make new lows than new highs.

Sometimes there can be divergences in the performance of an index vs. its constituents which analysts use as a contrarian indicator.

Let’s look at today’s example: Last week, the S&P 500 index made new lows in price, yet the New Highs – New Lows Percentage Index made a higher low. In other words, fewer stocks made new lows along with the index.

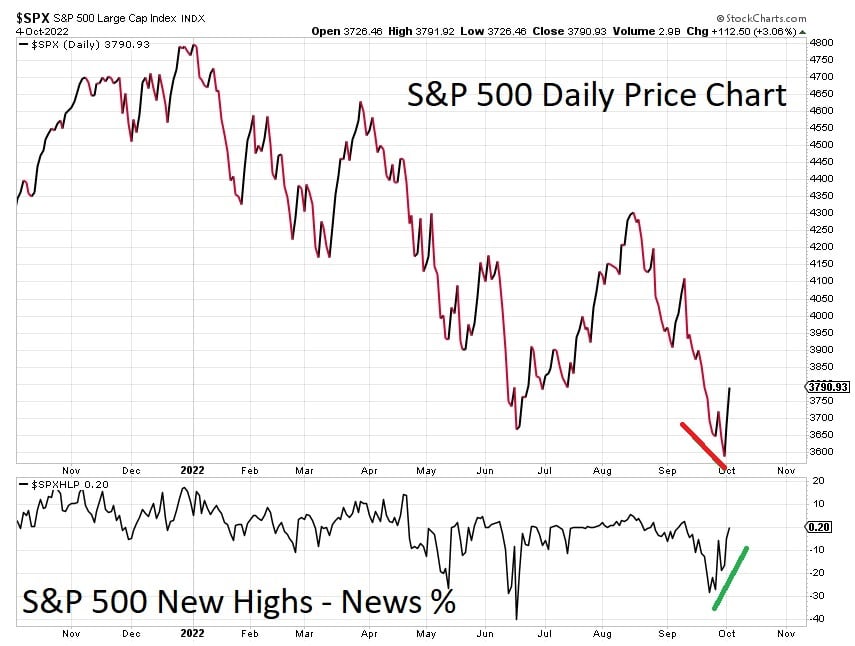
Technical analysts view this as a potentially bullish sign, particularly given the stock market’s strength over the last two days. They suggest that an improvement in market breadth is signaling the market could be undergoing a trend change. This thesis, however, is only valid if prices can stay above their recent lows along with the New High – New Low Percentage Index.

Breadth is a much broader topic that deserves a longer post, but we wanted to put out a quick explainer for those unfamiliar with the concept.

As always, we’ll have to wait and see how this develops in the days/weeks ahead. In the meantime, join the $SPY stream and share your thoughts on this theory. 💭

Learn More About...

More in   Stocks

View All

How The Ultra-Wealthy Fared In 2023

Just as 2022 was a challenging year across the board, 2023 was a great one. Let’s check in to see how the ultra-wealthy are set up heading into the new year. 👀

The Bloomberg Billionaires Index indicated that the net worth of the wealthiest 500 people soared by $1.5 trillion this year, recovering all of the $1.4 trillion lost in 2022. That came despite fears of recession, elevated inflation, higher interest rates, and geopolitical turmoil as markets (and the economy) climbed the “wall of worry.”

Read It

Japanese Stocks Continue Shining

One of the world’s best-performing stock markets of 2023 is starting the new year with fresh highs. As measured by the Nikkei 225 index, Japanese stocks reached their highest since the 1990s as investors speculated that the Bank of Japan would delay plans to end its ultra-loose monetary policy. 🕰ïļ

Recently, a devastating earthquake in central Japan caused widespread damage in the region and will likely weigh on the country’s already slow economic growth. As a result, the government is expected to outline fiscal stimulus efforts to help support the rebuilding process.

Read It

Definitely “A” Top, Maybe Not “The” Top

We don’t want to say CNBC caused the top in Super Micro Computer Inc., but they definitely pushed sentiment over the edge. ðŸĪŠ

Mania’s are hard to time, but most market participants agree that today was “a” top in the stock. What we all fail to agree on is whether it was “the” permanent top. Let’s see how it played out. 👇

Read It

Stocks End “Frothy February” On A High

Signs of froth in the market have been building since November and accelerated up in February, with the major indexes adding to their gains and tech giants becoming giant-er. Timing when the music will stop is a fool’s errand, but when it does end, we all inevitably look back through the lens of hindsight at the “obvious” signs things had gotten a bit crazy. ðŸĪŠ

Some more of those signs of at least a short-term peak in sentiment appeared today, so let’s check them out. 👀

Read It