We last talked about the 200-day moving average in October, when traders and investors were looking for the bear market rally to continue. One of the key areas they were watching was the moving average used to track the stock market’s long-term trend.
Flash forward six weeks, and we’re right back there with traders now highlighting it as another important inflection point. 📝
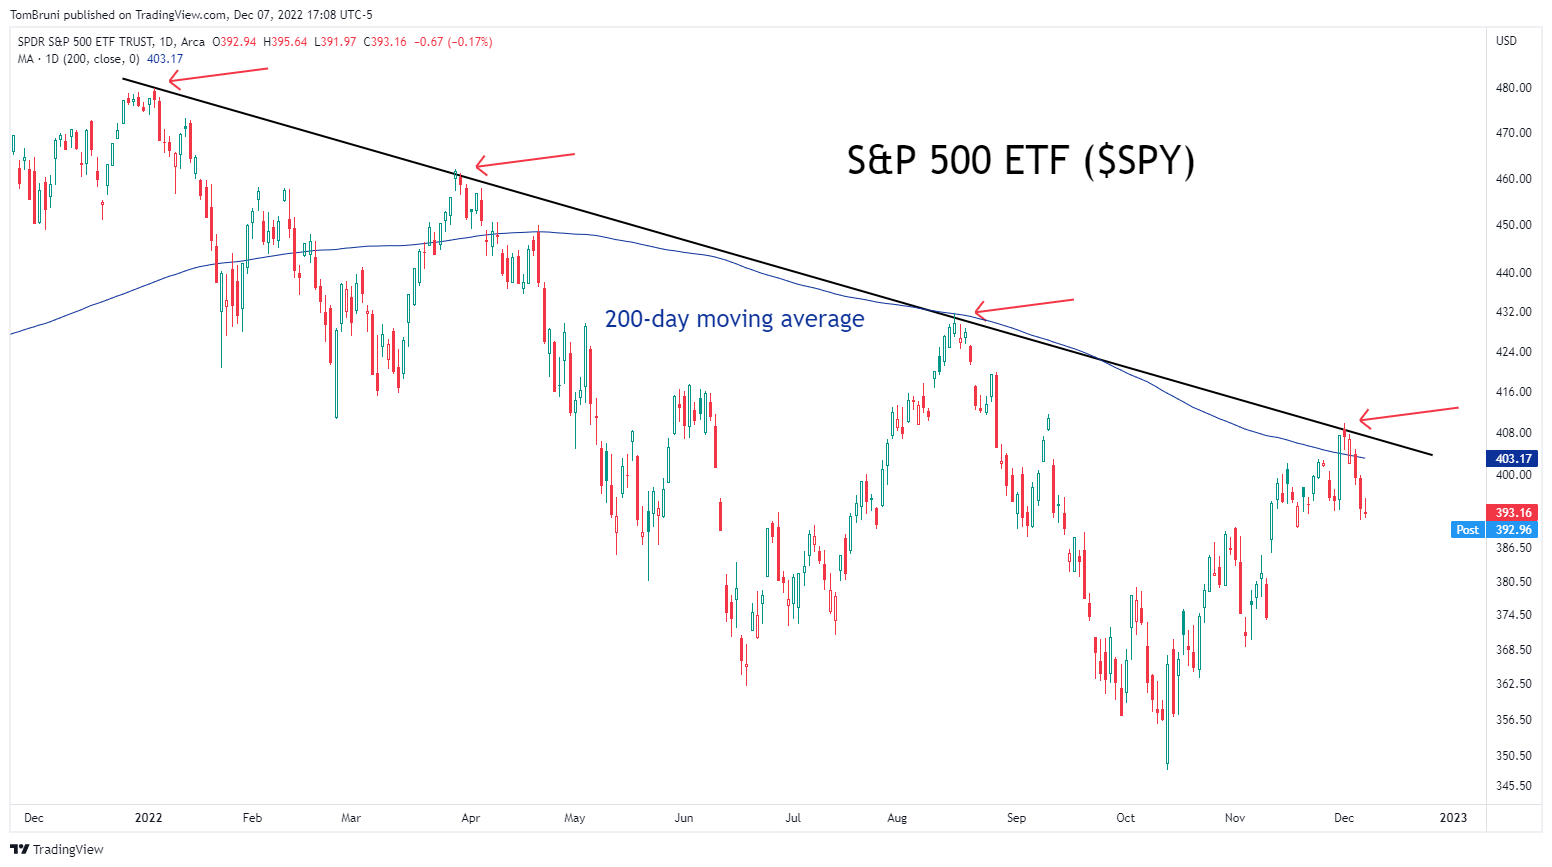
Today’s chart making the rounds is of the S&P 500 ETF ($SPY).
In it, we can see prices recently failing to break above what technical analysts call a “confluence of resistance” comprised of:
- A downtrend line from its January highs; and
- The downward-sloping 200-day moving average
Bearish analysts see this as confirmation that sellers have retaken control. They claim stocks are still in a bear market, and the path of least resistance is lower as long as prices are below their recent highs. Their bullish counterparts say that the current pullback is just a shakeout and that prices will soon break above this resistance level.
Who is ultimately right remains to be seen. But rest assured, this is a chart on many people’s radars as we head into year-end. 👀