Last week, we looked at where technical analysts are looking for buyers to emerge in the S&P 500. A similar chart emerged in the small-cap Russell 2000, so let’s review. 📝
As we’ve discussed, small and micro-cap stocks have been significant laggards for years. That said, some technical analysts are making the case for this group to lead a short-term stock market bounce.
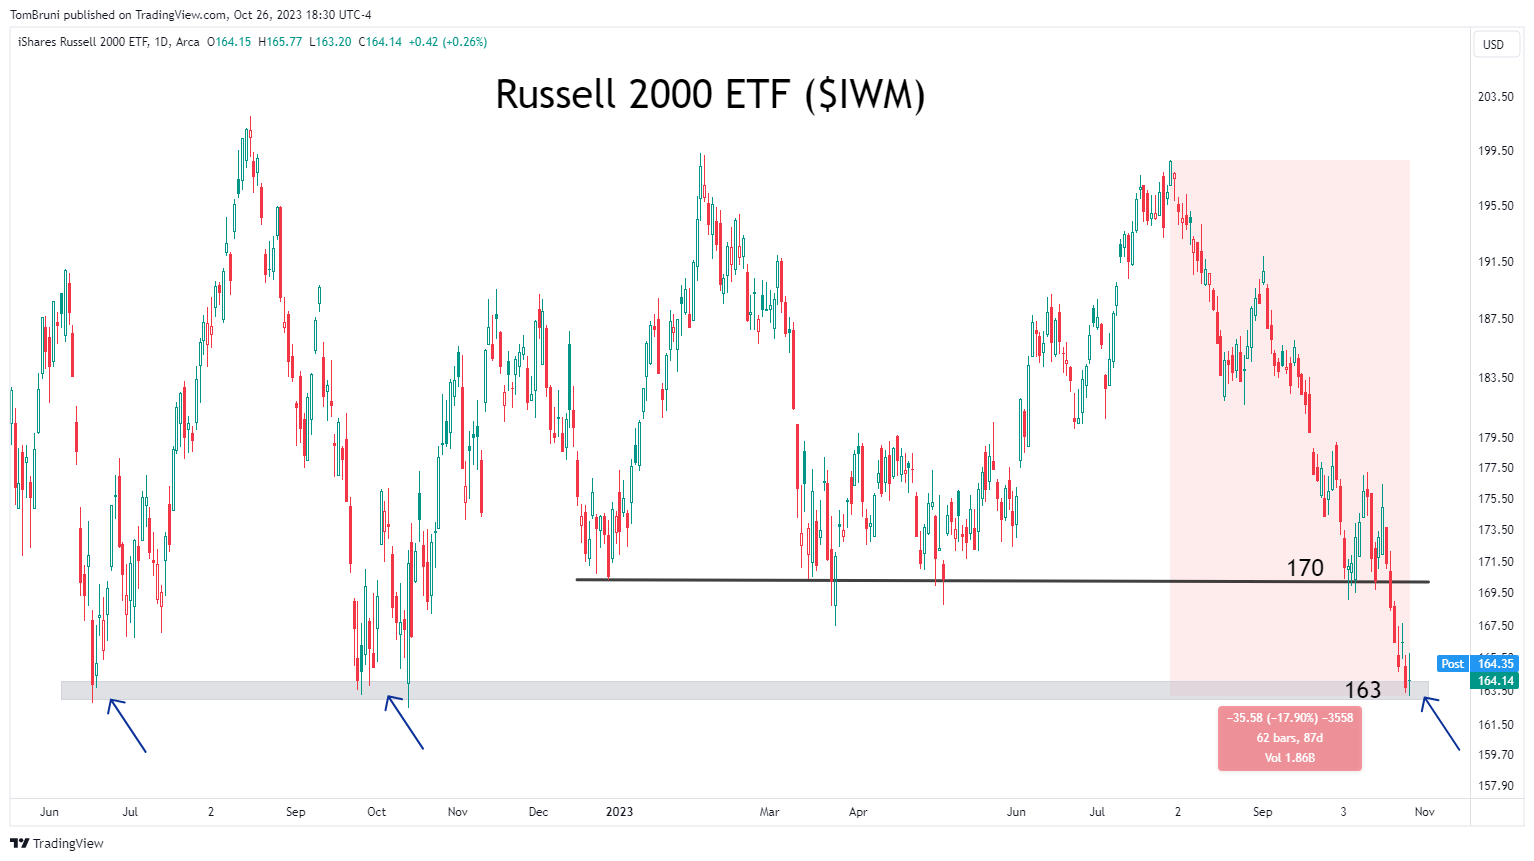
The thesis essentially looks at the last 15 months of price action, which has been a choppy mess. When prices reach the top of their range around 200, sellers emerge, and prices reverse. And when they get toward the bottom of their range around 163, buyers appear, and prices reverse. 📊
Well, we’re back down to that level now. Since the index has fallen 18% over the last three months, some argue it’s overly extended and could see a bounce. Others say that the fundamental headwinds are too strong and that big tech’s wreck will pull the entire market lower. 🐂⚔️🐻
As usual, we’ll have to wait and see. But that’s what technical analysts in the community are watching in the coming trading sessions. 🤷