Micro-Caps Back To 2018 Levels

This year, we’ve written a lot about a general trend impacting the stock market. That being, the larger the company, the better it has performed. πŸ’ͺ

As we can see from the chart below, the Nasdaq 100 and S&P 500 have led gains over the last five years. That’s primarily because mega-cap technology stocks, now dubbed “the magnificent seven” but previously known as FAANG or FANMAG, have driven a large portion of the gains. Meanwhile, the “riskier” small and micro-cap companies have struggled to progress.Β 

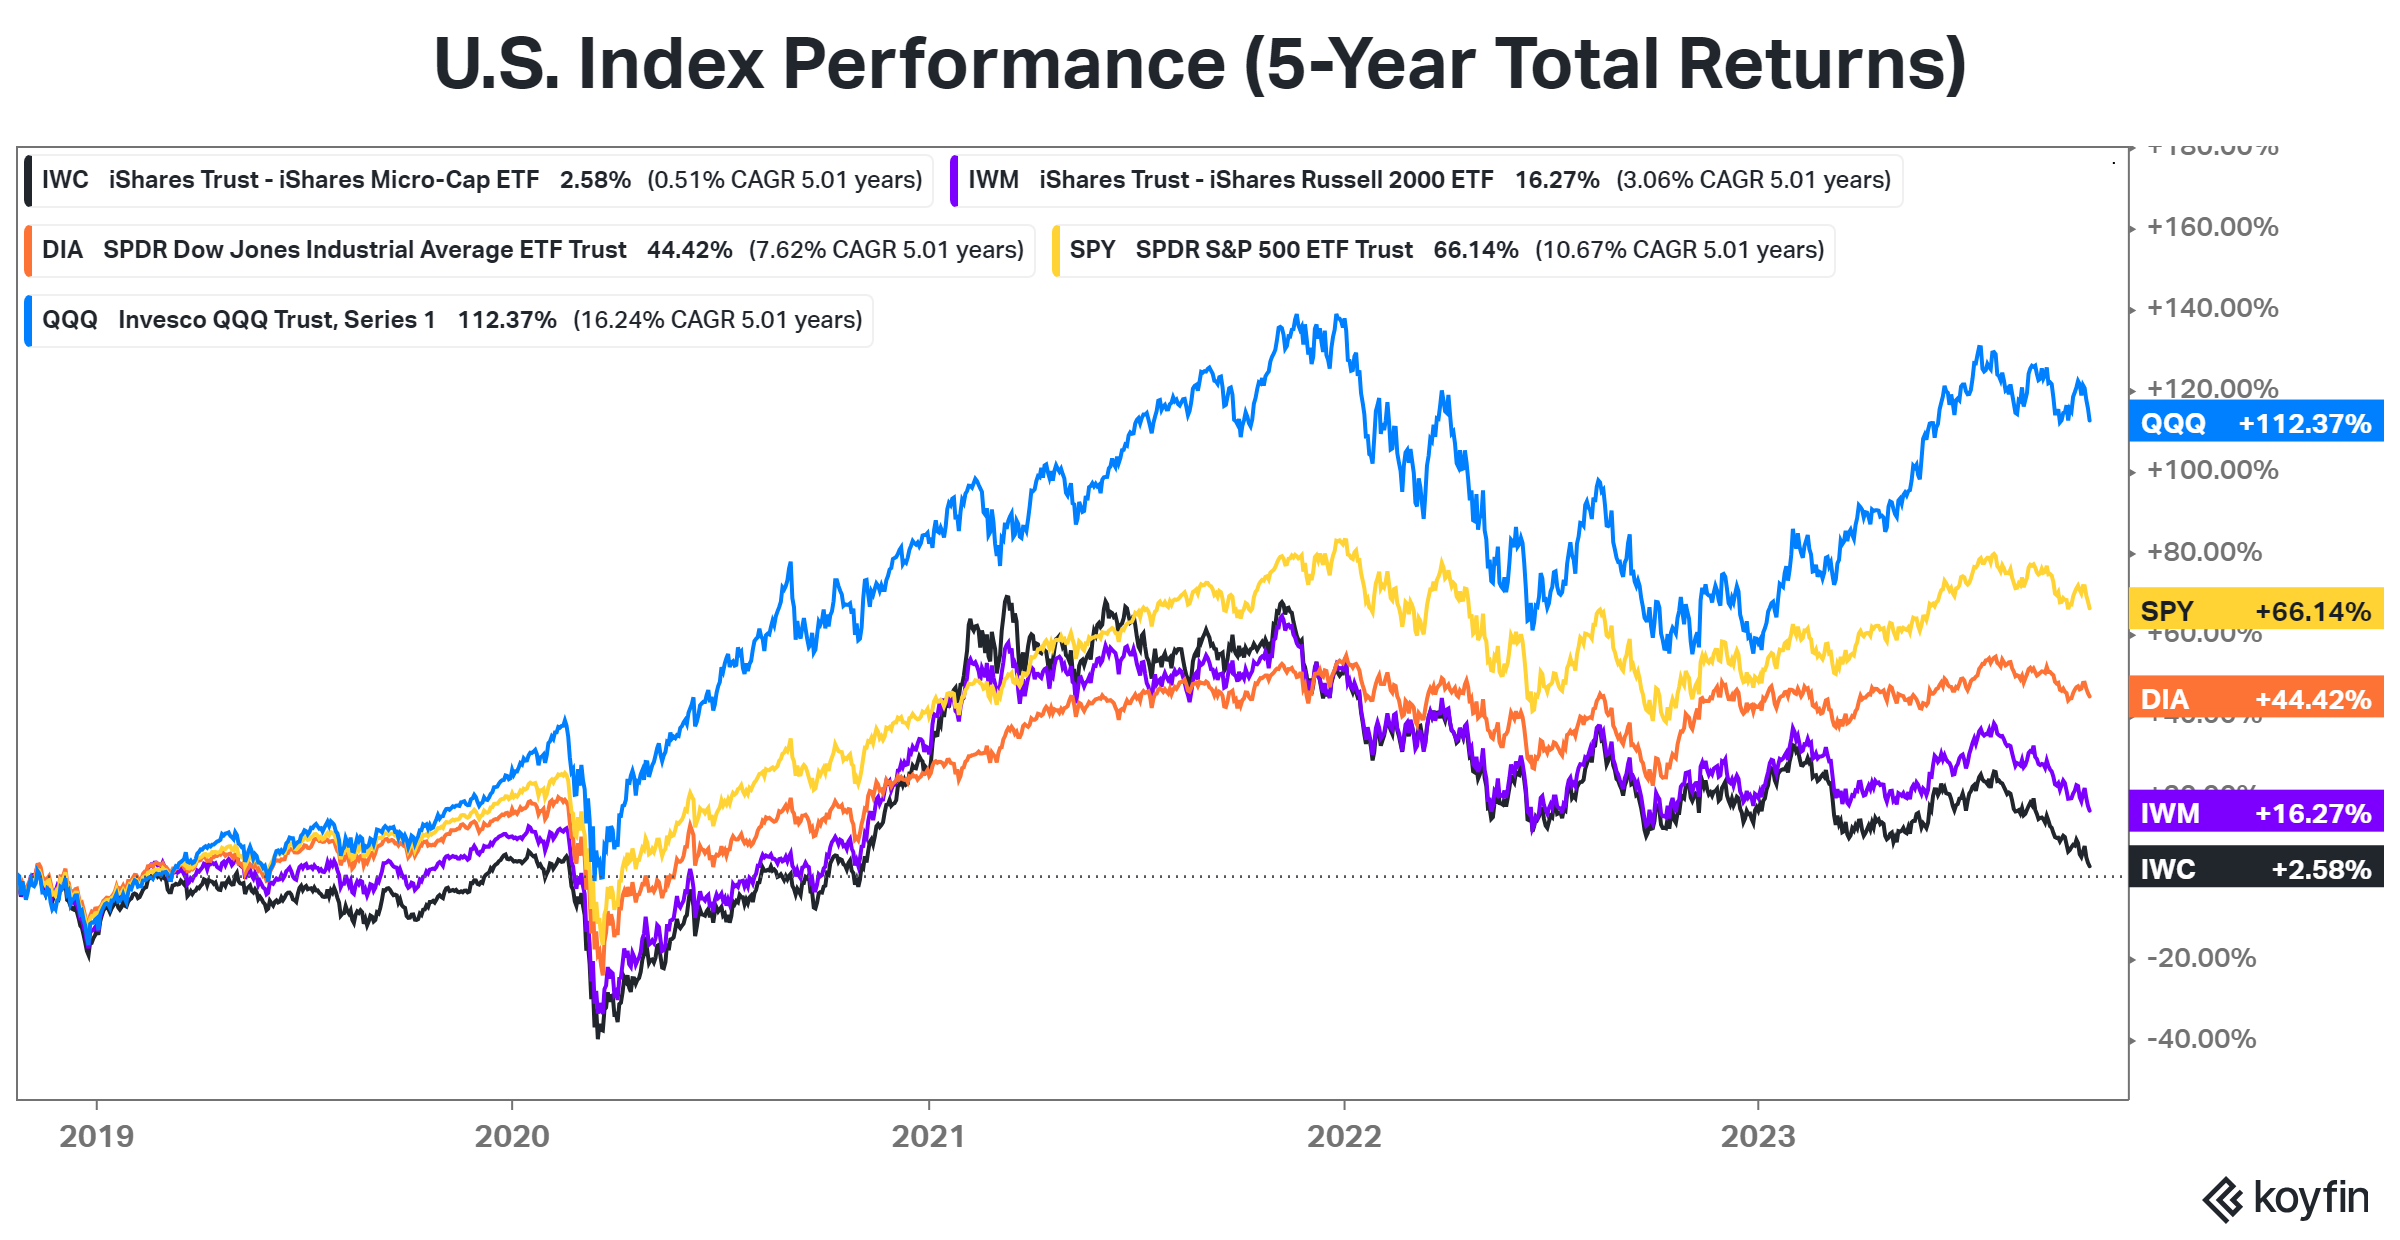
That trend continued this week, catching many investors’ attention because five-year returns in the micro-cap ETF $IWC neared the flatline. So not only did this market segment underperform during stocks’ rally, but it’s now leading to the downside. πŸ“‰

This flies in the face of conventional market wisdom that says “higher risk” assets like small and micro-cap stocks should offer a “higher potential return.” Instead, investors have been punished for taking additional on risk, leading to a decline in overall risk appetite in the stock market. πŸ™ƒ

With high interest rates and a slowing global economy, the environment for these smaller businesses is only getting harder. As a result, investors continue to flock to larger companies with robust balance sheets and lots of cash from their operations, allowing them to ride out any economic weakness more easily.

And it’s not the only segment of the market to come “full circle,” either. Many high-flying sectors from the pandemic are back to their pre-pandemic levels (or worse, below them). We’re not quite sure what the takeaway here is. Other than that, investing is hard. And as always, investors need to be selective in what trends they participate in and how they participate in them. 🀷

Learn More About...

More in   Stocks

View All

Stocktwits 2023 Year In Review

What a year it’s been for markets in 2023, with crypto soaring, tech stocks battling back, the economy staying upright, regional banks collapsing, and the Fed setting the stage to cut rates.Β 

The Stocktwits community was on top of it all, so what better way to recap the year than with some of our platform’s unique data? Let’s dive into it. πŸ‘‡

Read It

How The Markets Performed In 2023

As our article about the ultra-wealthy showed, 2023 was a great year for assets (especially the publicly traded ones). Let’s take a quick peek at how things panned out. πŸ‘‡

First, let’s start with the tech-heavy Nasdaq 100 index. The chart below shows that the index had one of its best rolling 12-month total returns in decades, rising 55%. The actual total return index also hit new all-time monthly closing highs, reiterating that bulls took back the momentum this year in a big way. 🀩

Read It

Traders Eye IPOs Into 2024

After a rough patch from late 2021 through 2022, this year, the initial public offering (IPO) tried to make a comeback. Now, traders say 2024 could be the year this turnaround really comes. πŸ‘Β 

Below is a chart of the Renaissance IPO ETF ($IPO), which is up about 53% so far this year. But technical analysts and traders say that its recent breakout to roughly eighteen-month closing highs signals a critical trend change in prices. They argue that prices staying above the 35-37 range, which has previously served as an inflection point in the stock, would suggest momentum has shifted firmly to the upside.Β πŸ™ƒ

Read It

Traders’ Updated S&P 500 Roadmap

Just because the calendar changes dates doesn’t mean the market’s trends do. As such, now seems like a great time to update the S&P 500 roadmap many traders used throughout 2023. πŸ—ΊοΈ

Below is a two-year daily candlestick chart with a few key indicators. The first is the 200-day moving average (blue), which traders use to track the long-term trend in the market. The next two are the anchored volume weighted average price (AVWAP) from the market’s 2022 highs and 2022 lows. Traders use this to track how the average buyer/seller has fared in the market from a specific date.

Read It