Bitcoin
It’s been a while since we’ve reviewed some of the prior long-term analyses on $BTC‘s charts. Let’s do that now because the price level and price action currently occurring on Bitcoin’s chart are areas we looked at months ago. 🔭
Oh, there’s a TL;DR (Too Long; Didn’t Read) summary if you can scroll down to if you want to skip the nerd speak.
We’re stepping back in time a little over six months ago to the September 2, 2022, Litepaper.

In either scenario, 2023 will be critical for Bitcoin within the Ichimoku system. Because in order for Bitcoin to maintain a clear and strong bullish trend, it will need to remain above the monthly Cloud.
The bottom of the monthly Cloud for 2023 starts at $10,000 and then moves dramatically higher until it reaches $33,000 in June 2023 before slowly increasing towards the $34,400 level in December 2023.” – September 2, 2022, Litepaper.
Next stop, January 4, 2023. 🚊

“From an Ichimoku perspective, Bitcoin is sitting in a position that makes me want to nerd out – the next three months are going to be exciting to watch.
Why? Because of Patel’s Two Clouds Theory (at least, that’s what I call it).
In Manesh Patel’s book, Trading with Ichimoku Cloud: The Essential Guide to Ichimoku Kinko Hyo Technical Analysis, Patel calls attention to an Ichimoku phenomenon that no other modern Ichimoku analyst has called attention to in book form. This is what he observed:
When a major trend change occurs, the Future Cloud is thin, with both the current Senkou Span A and Senou Span B pointing in the direction of the Cloud.
It’s a rare condition that is currently present on Bitcoin’s monthly chart:” – January 4, 2023, Litepaper
That brings us to Bitcoin’s current monthly chart: 📈
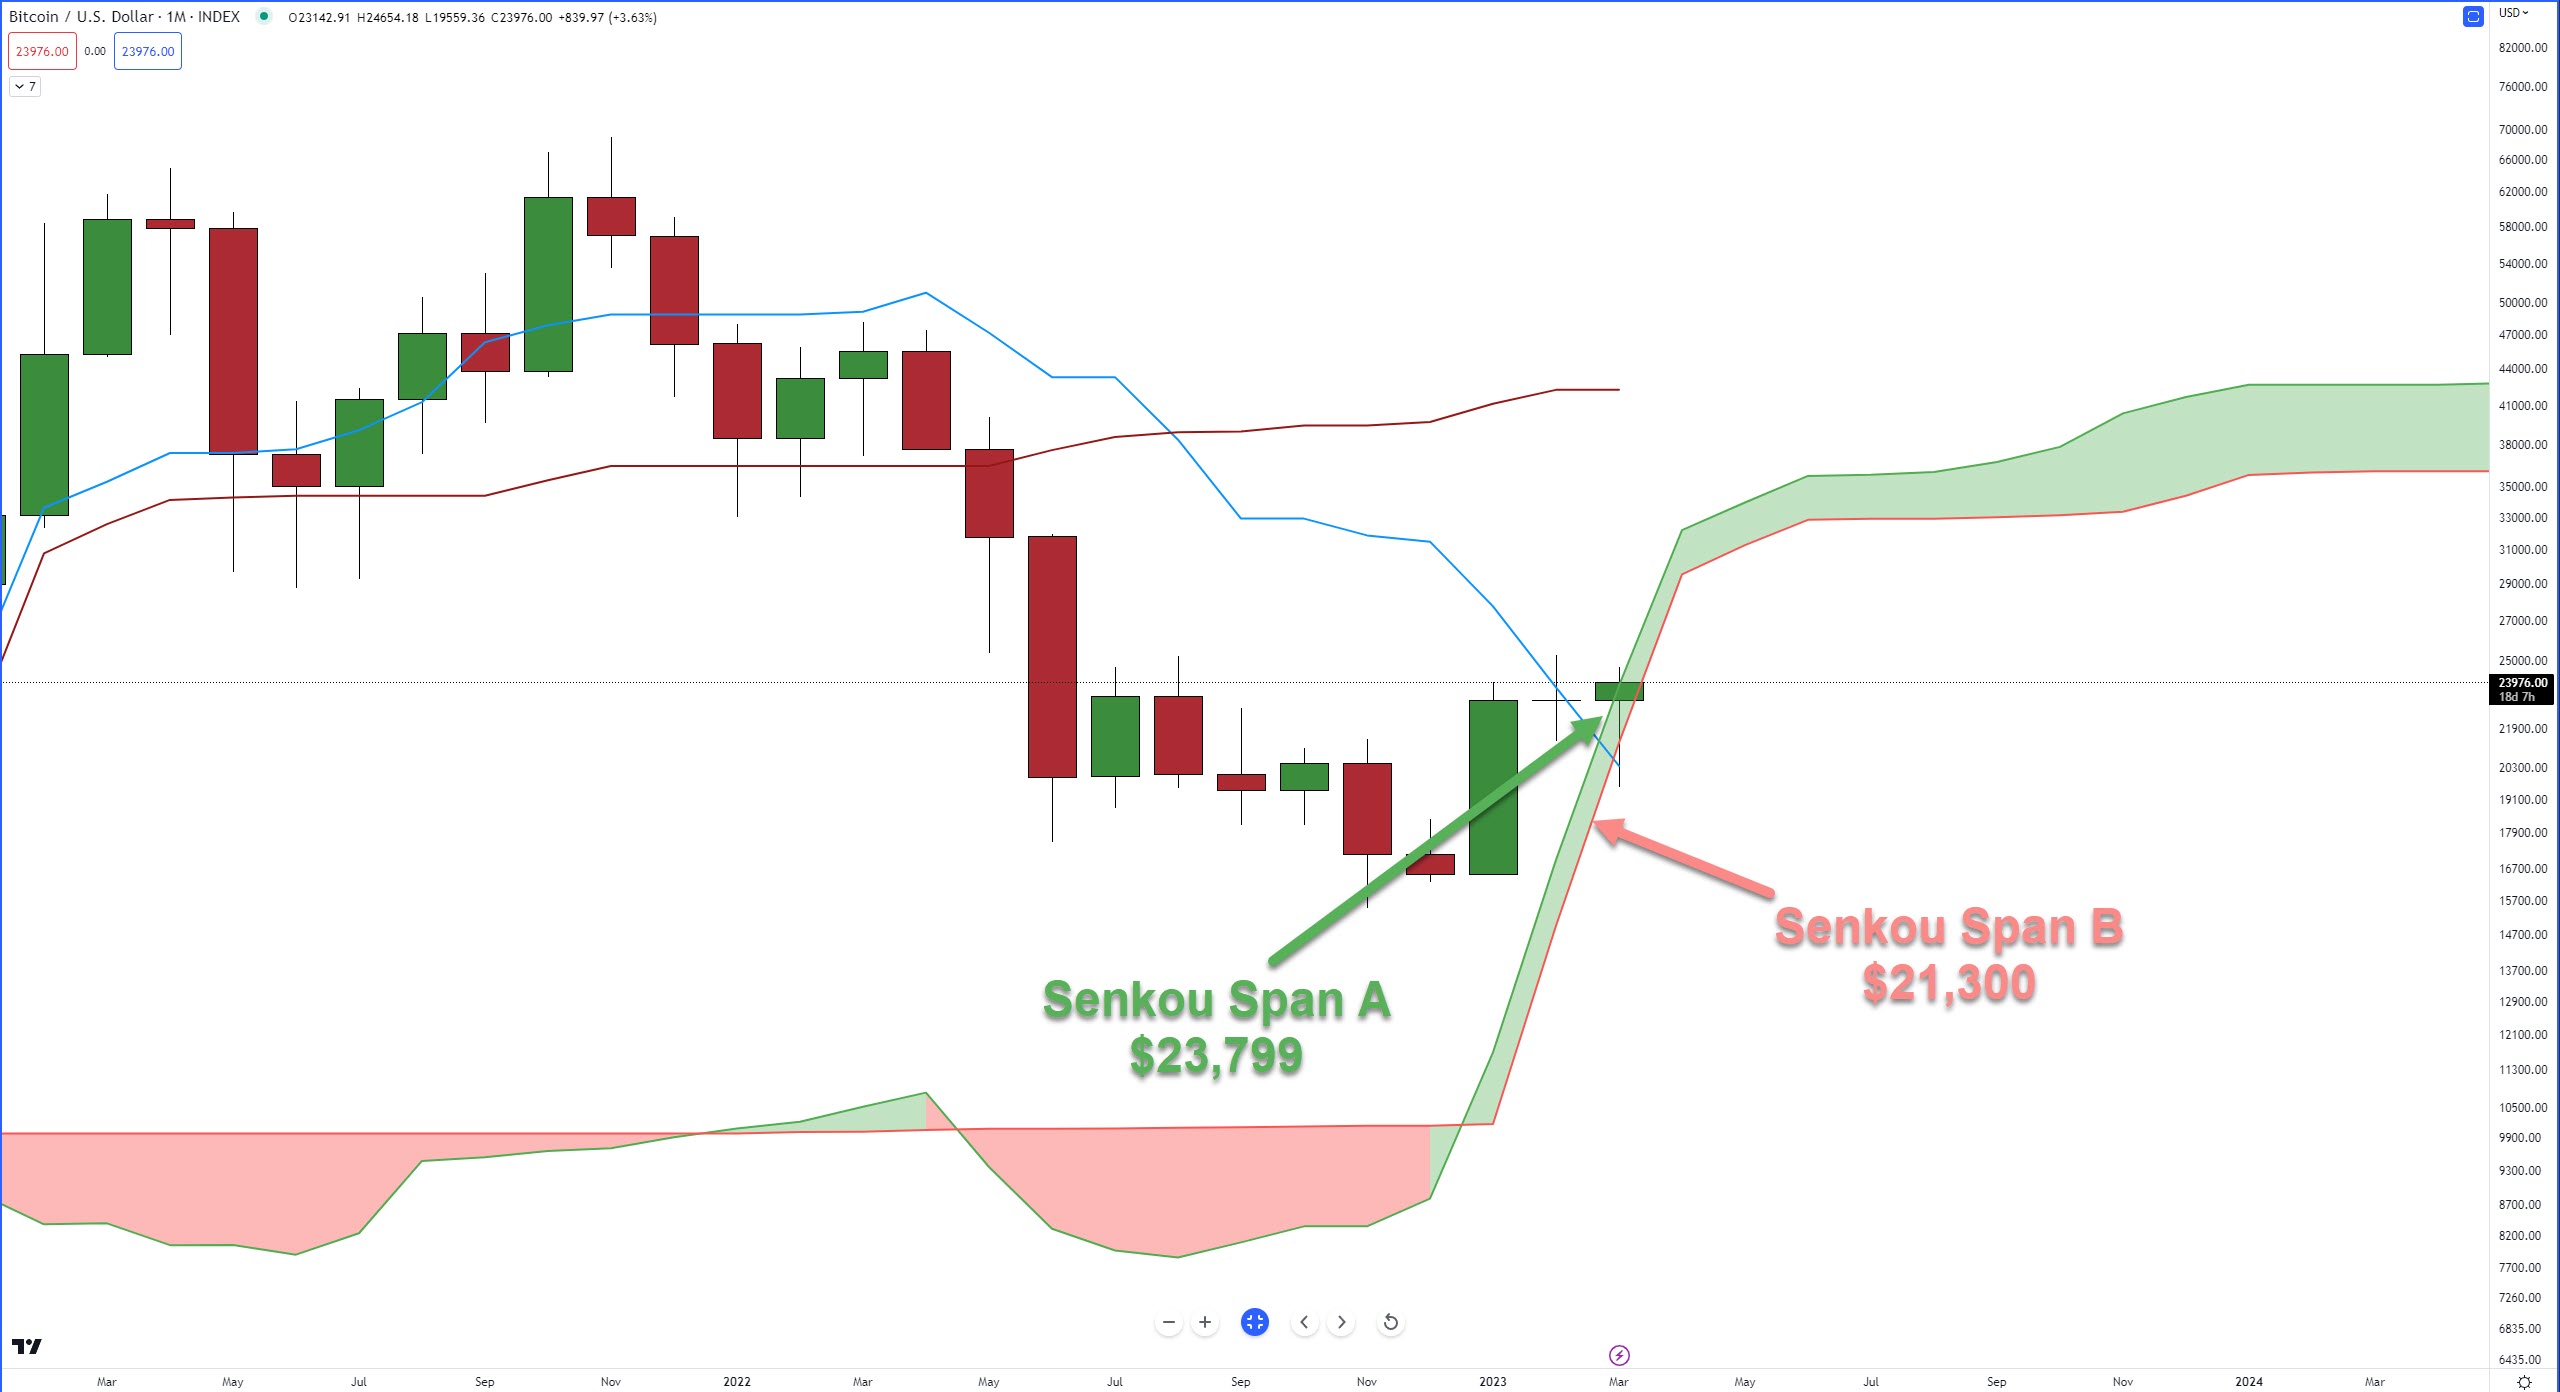
February 2023 was the flattest month in Bitcoin’s history – but it still closed above the Cloud.
March is almost halfway finished, and until this past Saturday (March 11), things looked bleak for the bulls.
Given that Bitcoin has been trading above the Cloud, it is unsurprising that it has exhibited persistence in remaining above it.
However, what deserves close attention is the state of price action in relation to the current structure of the Cloud, as outlined by Manesh Patel.
TL;DR
So, the question is this: if bulls want to keep Bitcoin moving higher, where will Bitcoin need to close to keep that momentum moving?
Answer: at or above $23,800.
If bears want to take control, where do they need to close March?
Answer: Below the Tenkan-Sen, at or below $20,367.
Ethereum
The first chart we’re looking at is from the February 1, 2023 Technically Speaking article. 📆
The primary takeaway for $ETH in that article was analysts warning that a massive rally for Ethereum in February might not be a good thing:
Bulls might not want to see a massive rally for Ethereum in February because of a Kumo Twist in March 2023.

A behavior of price action with the Ichimoku system with Kumo Twists is that they can sometimes identify where a turn in the market may occur.
If an instrument is trending strongly in a single direction into the Kumo Twist, then there is a high probability of the market facing a new major/minor swing.
Kumo Twists can help answer the question of when something might happen.
Fast forward to today, and this is what it looks like. 📆
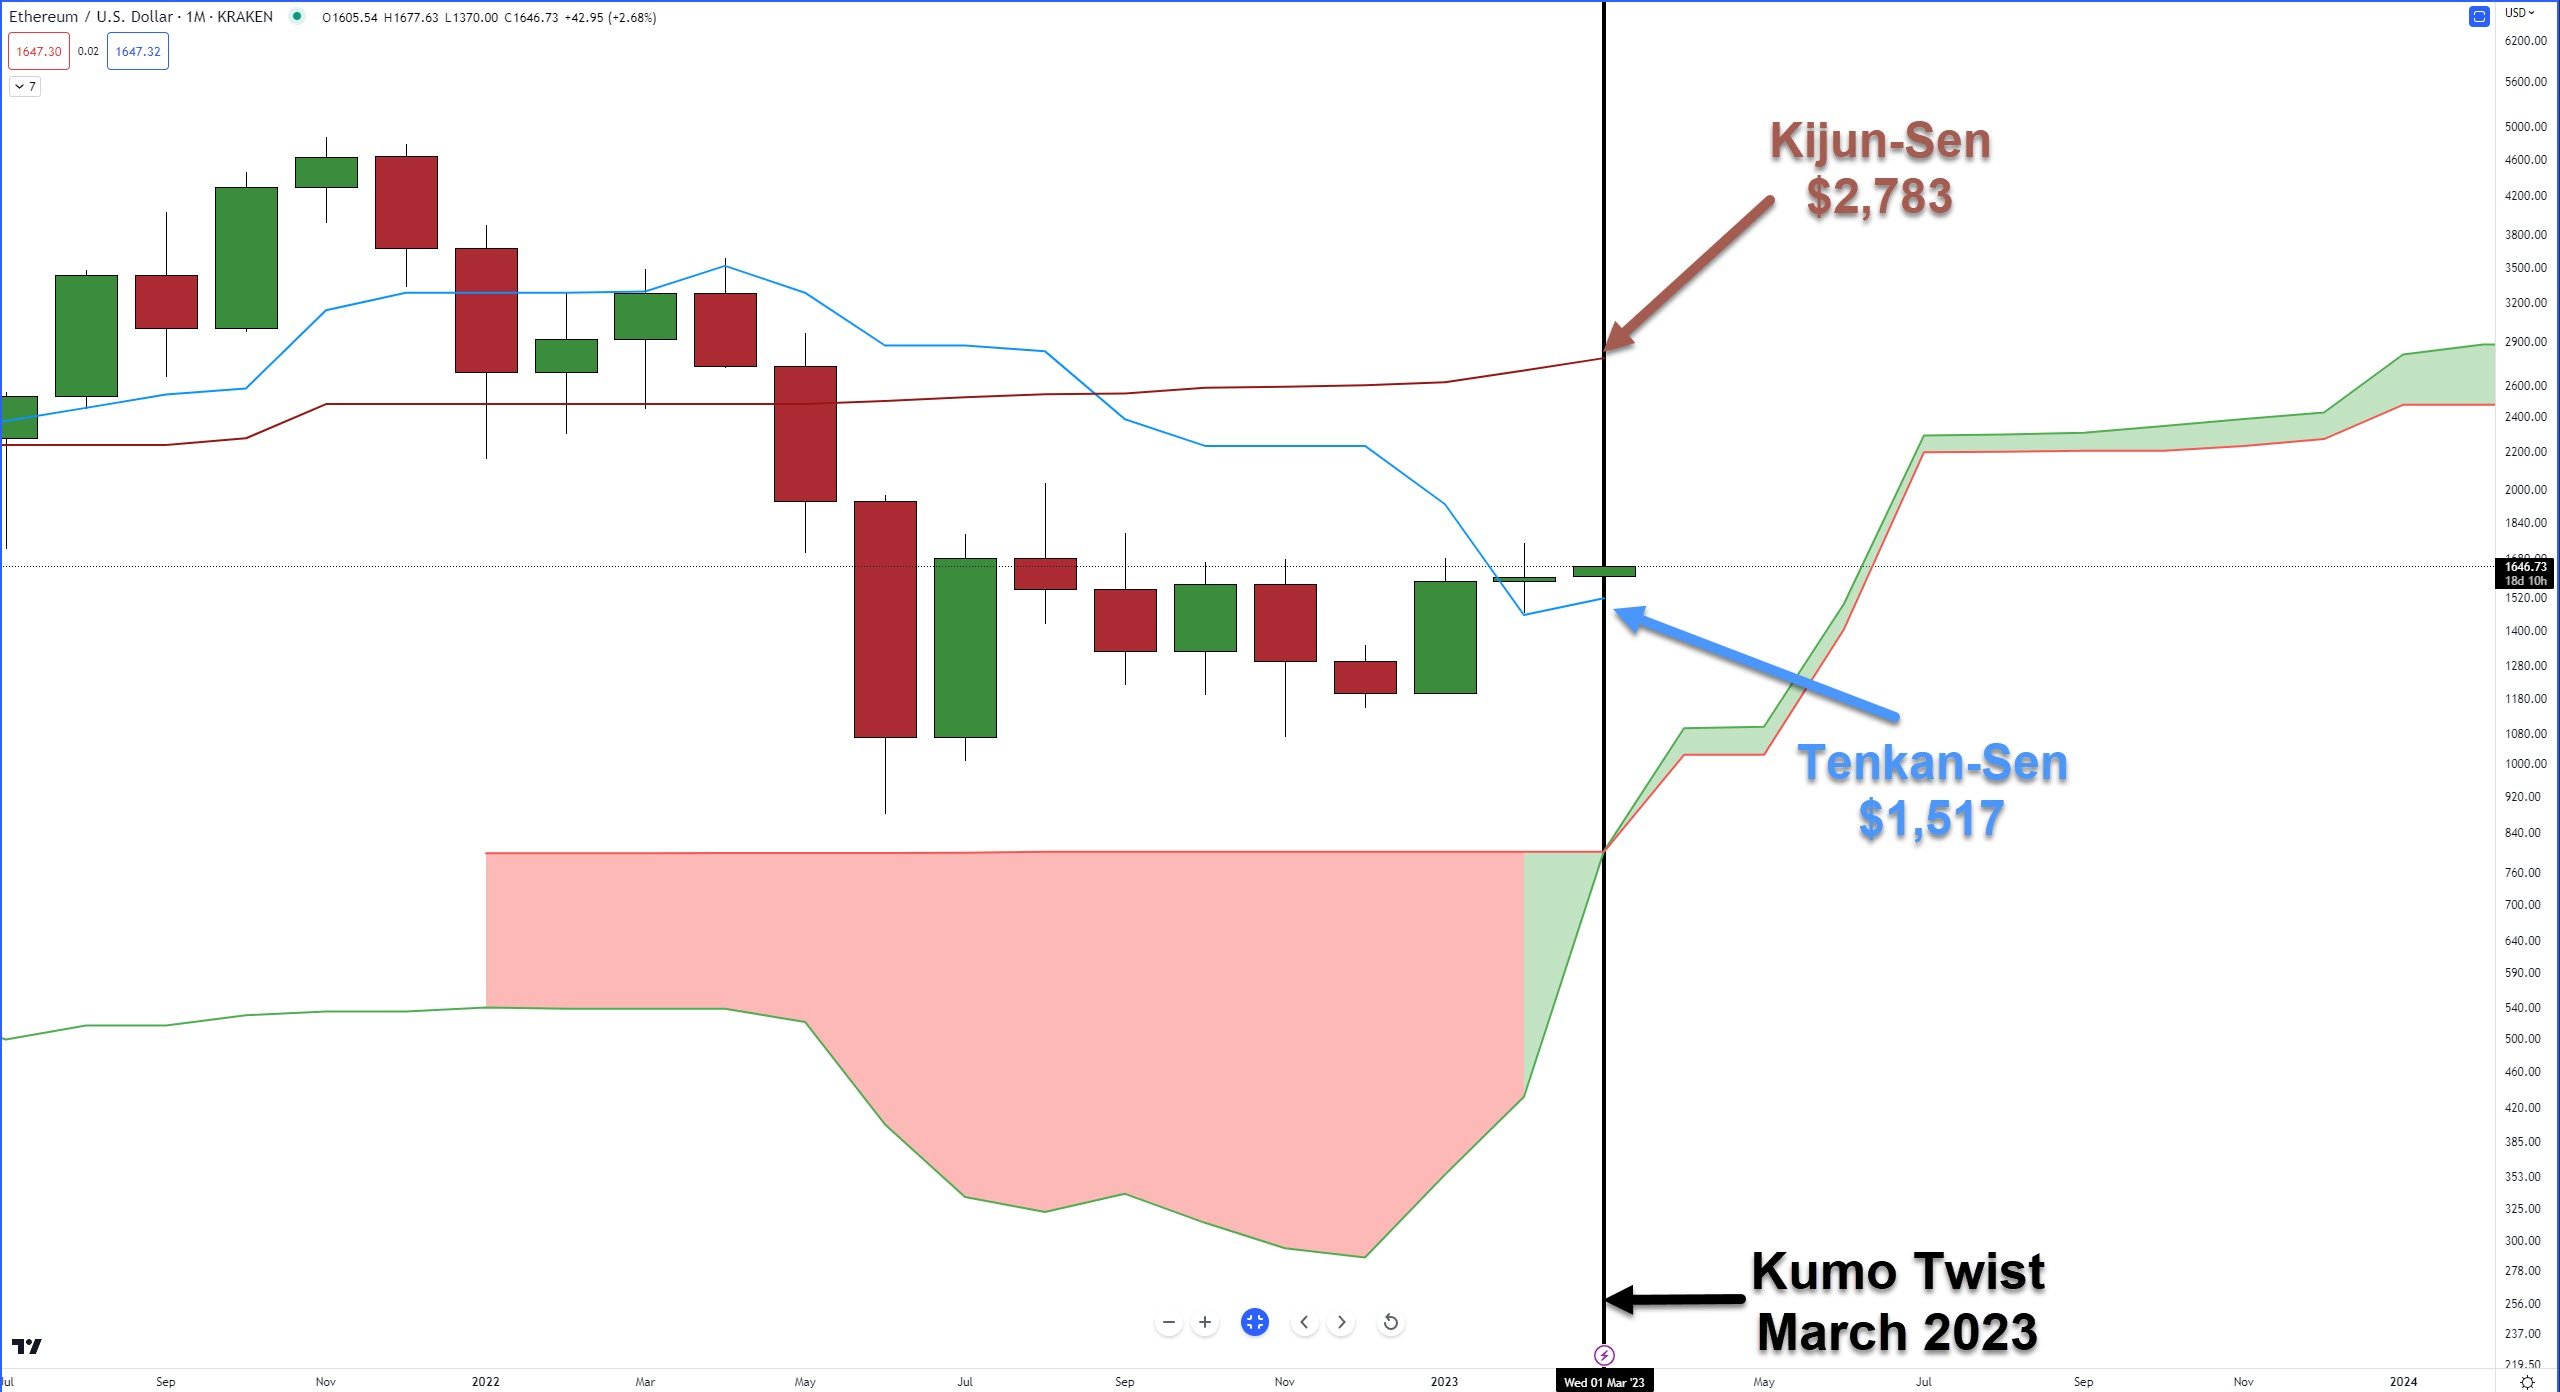
Note that February did close above the Tenkan-Sen. In the February 1 article, special attention was made because that was a significant event:
Ethereum is now above the monthly Tenkan-Sen for the first time since December 2021 – 14 months. – February 1, 2023, Litepaper
TL;DR
As long as bulls can close Ethereum’s monthly chart at or above $1,518, the upside potential remains strong.
For the bears, it’s a harder road compared to Bitcoin’s monthly chart. There are significant support structures near the psychologically important $1,000 value area.
We’ll update these as time progresses. Thanks for reading! 🤗