The fallout from FTX’s collapse keeps dropping, this time with FTX announcing it’s entering Chapter 11 bankruptcy – and it includes an entity everyone thought was unaffected: FTX.US.
To condense the major news events, we’ve created an FTX Megathread for you to follow in today’s Litepaper. Don’t want to waste time Googling what’s worth skipping and what’s worth reading? We believe we’ve got a good chunk of the relevant info in one place for you.
Today’s Litepaper also includes the updated staking yields of the Top 10 cryptocurrencies and an update on how the Stocktwits Custom Crypto Indices are performing relative to the rest of the crypto market.
Today’s price action is fairly surprising, given the bankruptcy news and everything else happening with FTX. The selling pressure has not been anywhere close to what we saw on Wednesday – but the weekend is coming up, and that’s when things go a little haywire.
Uniswap ($UNI.X) and Litecoin ($LTC.X) were the only two +$2 billion market cap cryptos that showed a positive day today – nearly everything else was down.
Here’s how the rest of the market looked at the end of the trading day:
| Uniswap (UNI) |
$6.09
|
5.80% |
| Litecoin (LTC) | $60.50 | 0.30% |
| Ethereum (ETH) | $1,267 | -2.17% |
| Stellar (XLM) |
$0.09
|
-4.06% |
| Ethereum Classic (ETC) |
$20.99
|
-4.29% |
| Chainlink (LINK) | $6.88 | -4.34% |
| Cosmos (ATOM) | $16,759 | -4.34% |
| Bitcoin (BTC) |
$0.09
|
-4.50% |
| Cardano (ADA) |
$0.35
|
-4.68% |
| Shiba Inu (SHIB) |
$0.0000097
|
-4.72% |
| Altcoin Market Cap |
$485 Billion
|
-3.66% |
| Total Market Cap | $806 Billion | -4.19% |
All The Big News – December 2, 2022
Accusation That FTX Misused Customer Funds Presents a ‘Prison’ Problem, Says Crypto Legal Expert Jeremy Hogan From The Daily Hodl
U.S. Trustee asks bankruptcy court to appoint FTX trustee From The Block
FTX Japan drafts plan to return client funds From Cointelegraph
Sam Bankman-Fried’s still sorry, but now he says his memory isn’t great From The Block
Bitcoin
We’ll keep this short and sweet because it’s more of an update to the charts in the November 9 Technically Speaking article.
On Wednesday, analysts were observing the failed test of the breakout above the triangle on Bitcoin’s chart. Analysts are now looking at an area near yesterday’s high near the $18,00 value area.
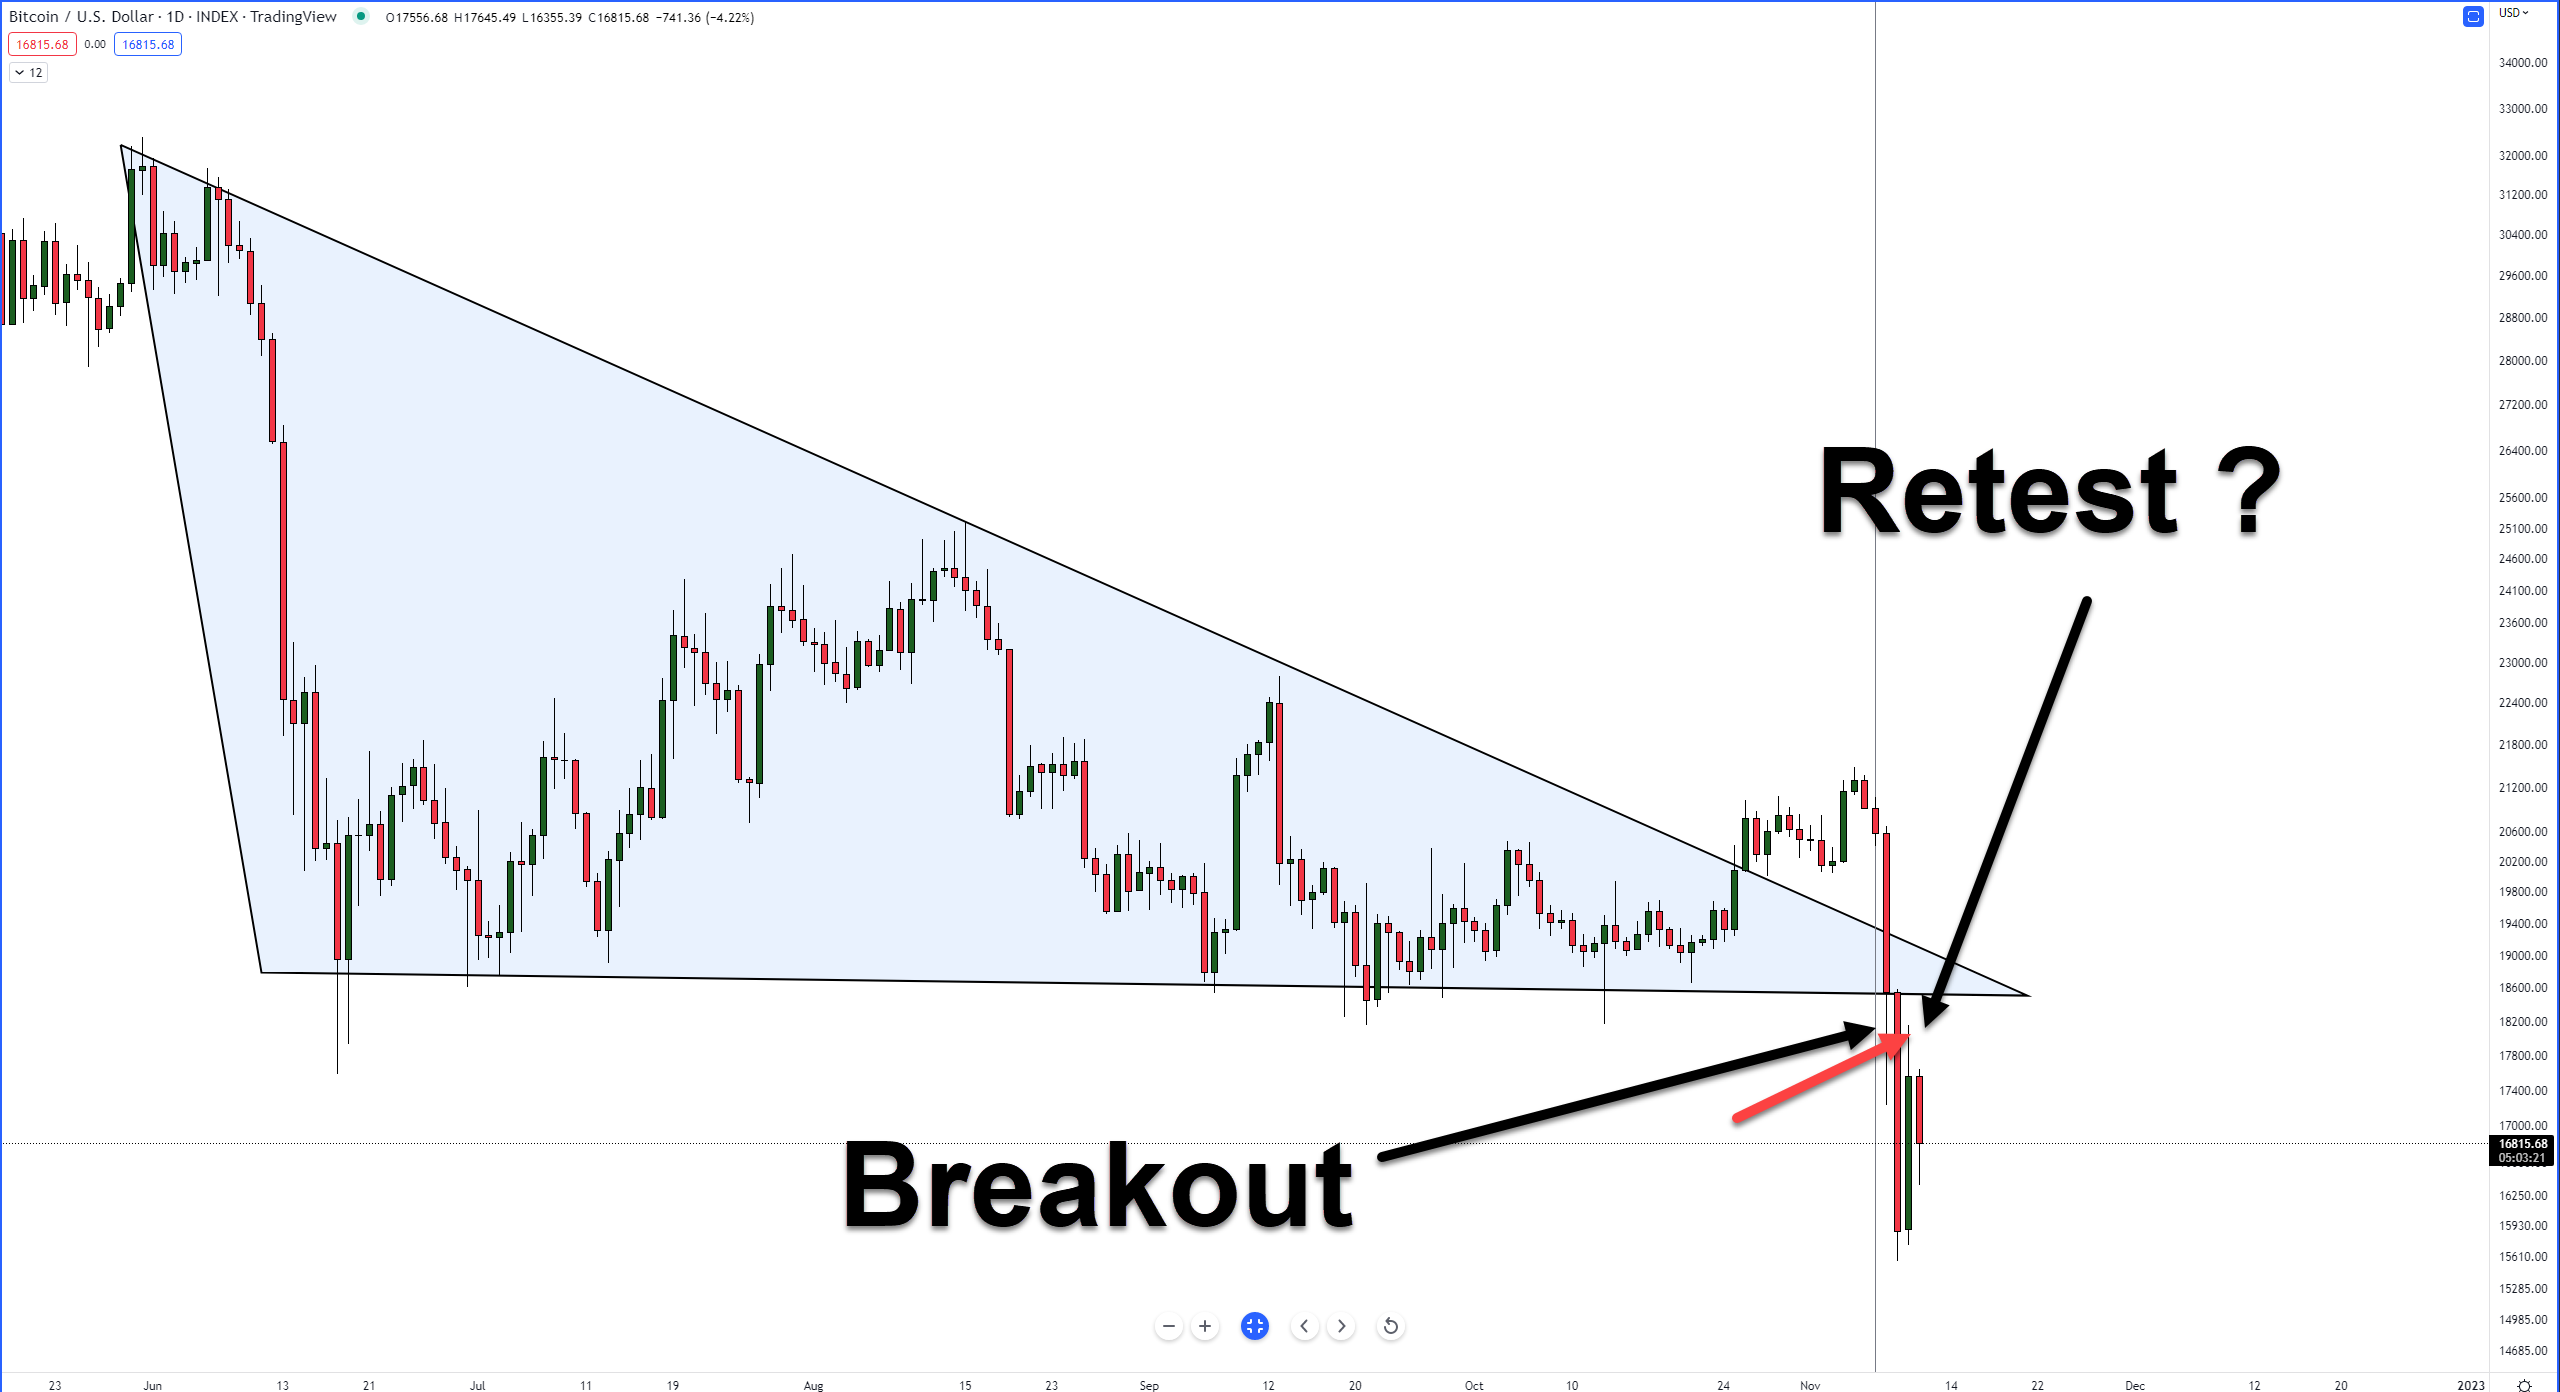
Why? Because for some analysts, the criteria for a retest of the breakout below the triangle has been completed. And unless something drastic changes, the failure of bulls to prop up BTC’s price could signal another round of selling, likely towards the $11,000 range.
Ethereum
The same thing with Bitcoin; analysts are looking at the broken trendline on Ethereum’s ($ETH.X) monthly chart.
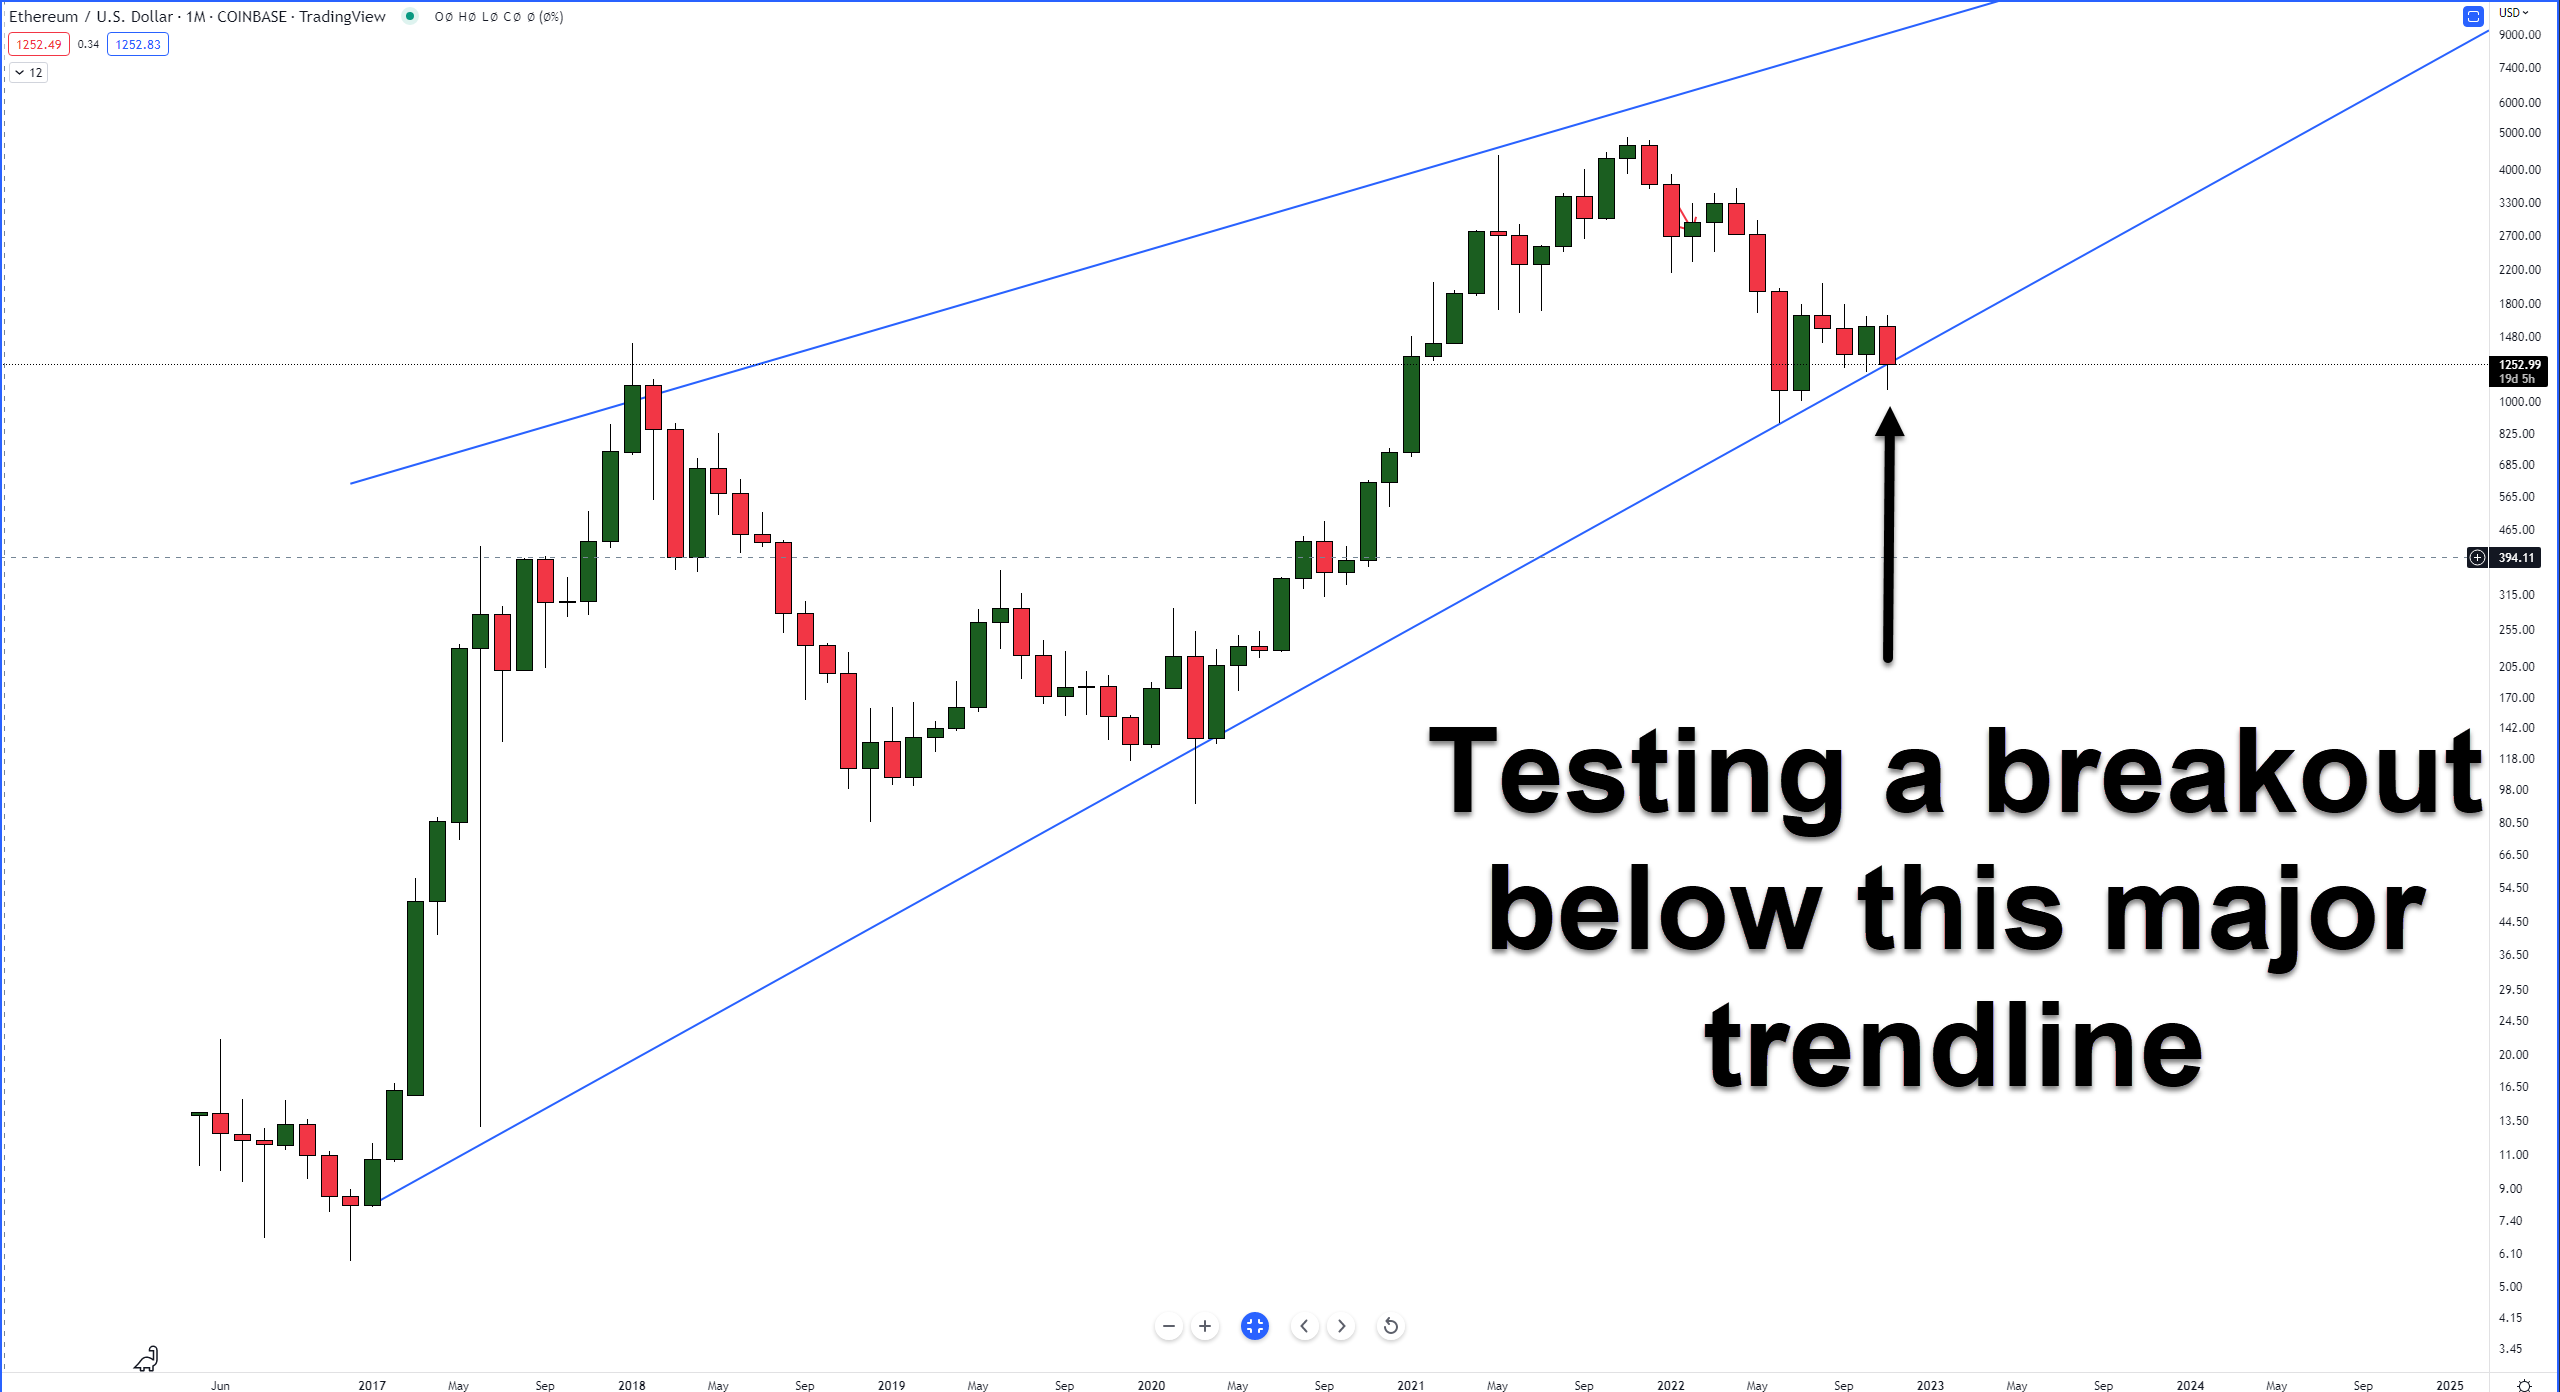
At the time of writing, it shows that bears have made multiple drives below the trendline, but analysts believe there are signs of bulls defining that trend line. There’s plenty of November left, though, so we’ll keep a close eye on it.
Traders anticipate a move below the $1,000 value area if the trend line fails to hold as support. 📈
Relative Rotation Graphs (RRG) are useful visual tools to identify how an instrument or a sector performs against a benchmark. The RRG image below shows eleven customized crypto indices. Each contains the top ten by market cap (excluding stablecoins and some exchange-based tokens).
The indices are Altcoins, DeFi, Decentralized Exchanges, Metaverse, Play-To-Earn, Proof-Of-Work, Privacy, Smart Contracts, Top 10 Market Cap, and Yield Farming.
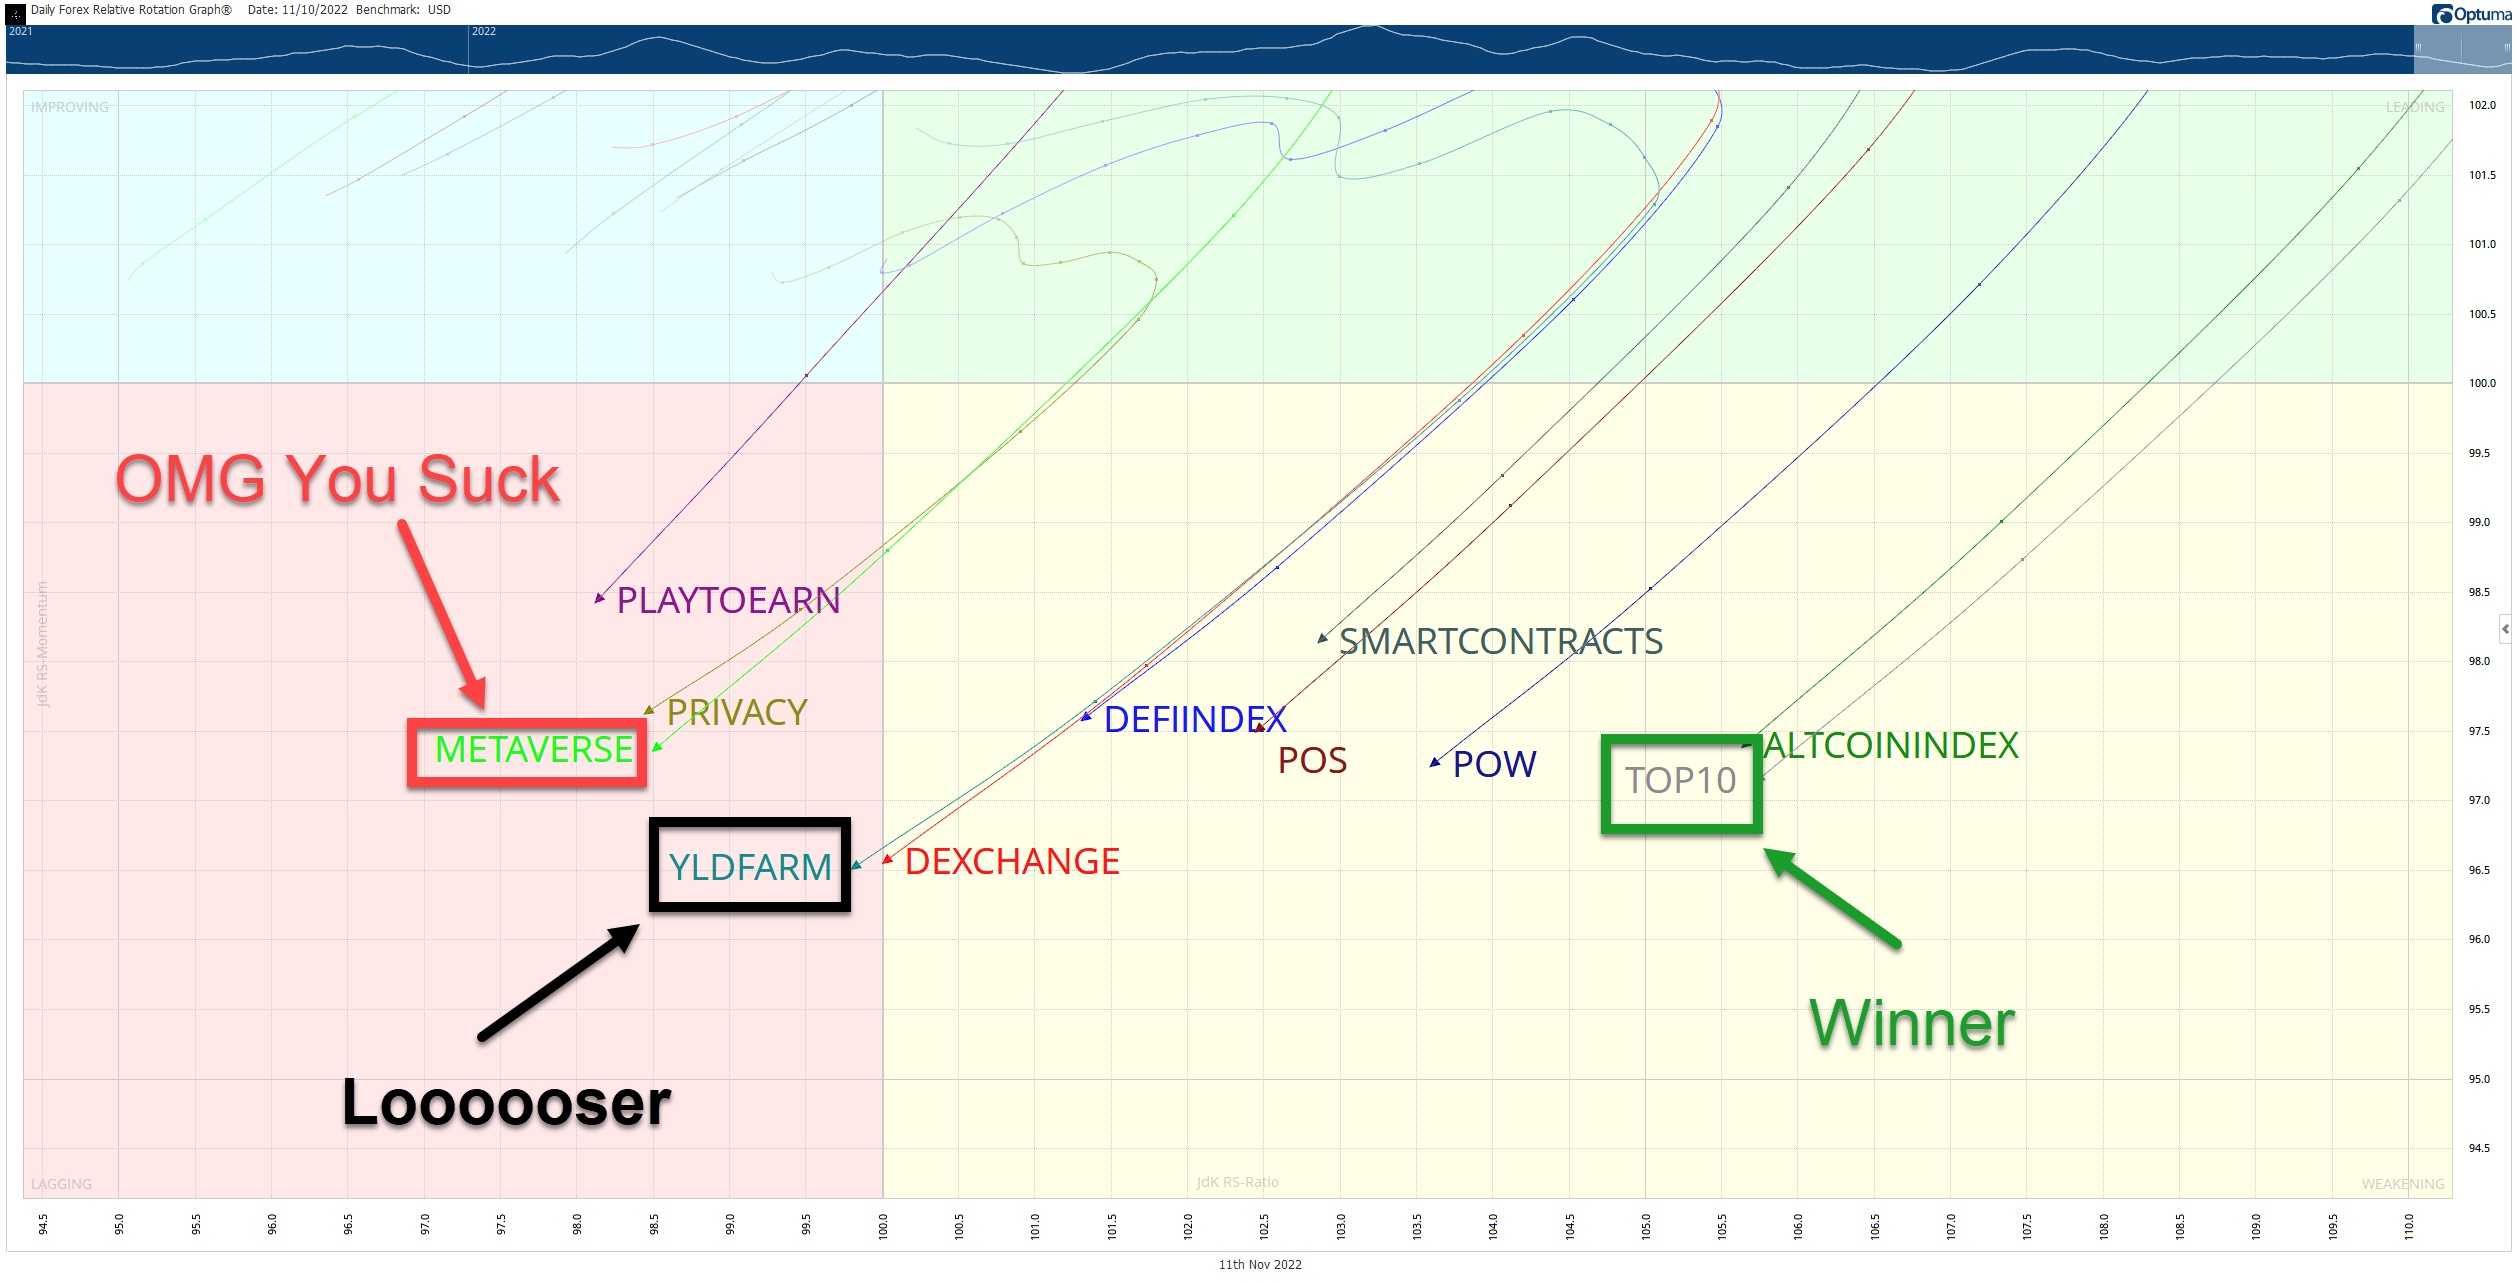 Without going into the nitty-gritty details, the four colored sectors can be thought of like this, so imagine you’re in a race:
- Leading Quadrant (green) – You are in 1st, 2nd, or 3rd place. You are leading the pack. You’re going to medal. Anthems will be sung, tears will fall, and you may or may not pass a doping test.
- Weakening Quadrant (yellow) – You’re losing your momentum; you’re out of breath. You just realized that your spouse or your mom didn’t show up to watch you, sapping your enthusiasm. You’re falling back and in the middle of the pack.
- Lagging Quadrant (red) – You pulled a hamstring. You pulled a Michael Scott and ate five pounds of fettuccine alfredo an hour before your race. You fell down. You’re dead last. No anthems will be sung, but tears will fall, and no one will remember your name.
- Improving Quadrant (blue) – You see your spouse or your mom in the stands. The crowd starts to see you get up. Emotional music begins, and the camera pans to the crowd standing in slow motion. You’re back on your feet and back in the middle of the pack, gaining on the leaders.
So, who sucks, who is losing and who is winning? Let’s look.
Winner – Top 10 Index
Top 10 Index examples: Bitcoin ($BTC.X), Ethereum ($ETH.X), and Polygon ($MATIC.X)
Not a huge surprise here. The Top 10 Index continues to take the lead – but barely. The Altcoin Index is close behind, and really, it’s a toss-up between the two.
OMG You Suck – Metaverse Index
Metaverse Index examples: ApeCoin ($APE.X), Zilliqa ($ZIL.X), and WAX ($WAX.X)
Just like Meta ($META), the Metaverse Index is the big laggard and has fallen the fastest with the momentum that suggests it may continue to nose dive.
Loooooser – Yield Farming Index
Yield Farming Index examples: AAVE ($AAVE.X), Compound ($COMP.X), and Uniswap ($UNI.X)
The Yield Farming Index is the biggest laggard and worst performer. However, its fall wasn’t dramatic it mostly just slid into the biggest loser category as opposed to flopping into it as the Metaverse Index did. 🏎️
The table below is the current (November 11, 2022) staking yield rates of the top ten cryptocurrencies by their market cap. Not all cryptocurrencies have a staking mechanism on their networks, so, for example, you don’t see Bitcoin ($BTC.X) listed.
Staked % is what percent of the total supply of that cryptocurrency is currently used to earn staking rewards. Sometimes called ‘Locked Up.’
The Lock-Up Period is how long crypto must stay staked before you can withdraw it and/or any rewards earned.
Nominal Yields are the rewards listed, whereas Real Yield is the expected return when factoring in other costs, factors, or changes like inflation rates (not listed).
It should also be noted that calculations and factors for Real Yields can vary substantially from one week to the next. Additionally, the Nominal Yield may have an expected range but is not guaranteed. For example, Polkadot’s ($DOT.X) Nominal Yield is advertised/listed between 8% to 14%.
Another factor to consider is that the rewards are not in US Dollars but in token/crypto your stake. Staking Cardano ($ADA.X) rewards you in ADA and so forth.
This table is updated weekly.
| Crypto | Staked % | Lock-Up Period | Nominal Yield % | Real Yield % |
|---|---|---|---|---|
| Ethereum (ETH) | 13% (+0.1%) | 12+ months | 6.8 % (+2.8%) | 3.5% (+2.4%) |
| Cardano (ADA) | 71% | None | 3.8% | 1.7% |
|
Solana (SOL)
|
77%
|
2 Days |
7.2%
|
1.6%
|
|
Polygon (MATIC)
|
34.2% (-1.2%)
|
9 to 10 Days
|
5.1% (+0.2%)
|
3.3% (+0.2%)
|
| Polkadot (DOT) | 50.4% (-0.6%) | 28 Days | 14% (+0.01%) | 6.9% (+0.01%) |
|
Tron (TRX)
|
46.6% (+0.03%)
|
N/A
|
3.9% (-0.2%)
|
2.1%
|
|
Cosmos (ATOM)
|
64.5% (-0.02%) |
21 Days
|
20%(+0.01%)
|
6.0%
|
|
Near (NEAR)
|
46.1% (-0.02%)
|
36 hours |
10.5%
|
5.4%
|
|
Flow (FLOW
|
53.5%
|
7 Days | 9.3% | 4.1% |
|
Elrond (EGLD)
|
59.4% (+0.3%)
|
N/A
|
8.9% (-0.1%) |
3.4%
|
Source: staking.us/yields
There are marginal drops in the total staked supply for Polygon ($MATIC.X), Cosmos ($ATOM.X), and Near ($NEAR.X) and marginal gains for Elrond and Tron. Next week may show some major changes due to the FTX disaster unfolding.
Cardano might be the asset to watch for any FUD from stakers. Cardano ($ADA.X) doesn’t require a lock-up period, so if there is a major drop, it might signal further unstakes across the board.
Real yields are mostly unchanged, except for Ethereum ($ETH.X), which saw its real yield more than double to 3.5%.
Tron may be the more interesting of the bunch to observe if the arrangement between FTX ($FTX.X) and Tron ($TRX.X) works out.
Bullets
Bullets From The Day:
👍 Need a bit of positive news? Grayscale’s $GBTC wasn’t immune to the crash felt on Wednesday, getting slammed along with the rest of the market. However, as a result of the collapse, the Discount to NAV fell to an all-time low: a whopping 40%. See the chart on ycharts
🟨 One asset-backed crypto has outperformed the broader cryptocurrency market – but it’s not surprising when you learn which asset it’s backed by: gold. Paxos’ PAX Gold ($PAXG.X), following Gold’s move ($XAU), is up nearly +6% for the week at the time of writing. That’s quite a performance for PAX Gold, considering US Dollar-backed stabled coins have flirted with breaking their peg. Full story from Blockworks
🪙 MicroStrategy ($MSTR) founder and Bitcoin bull Michael Sayler voiced his concerns on CNBC that FTX’s disaster could “…strengthen the hand of the regulators. It’s going to accelerate their intervention. There’s a regressive regulation, which is to say, you can’t really do anything, and that’ll contract the industry.” Saylor also believes that the industry is moving out of the entrepreneurial stage and into a more traditional finance space. Watch the interview on CNBC
Links
Links That Don’t Suck:
♣️ Crypto gaming needs to be fun to be successful — money doesn’t matter
🛳️ Leading NFT Marketplace OpenSea Explains Why They Are Continuing To Enforce Creator Fees
↗️ Crypto exchange Bitget to increase headcount 25% by year-end despite market conditions
💢 MakerDAO’s new update may reduce risk for its users; here’s how
⛓️ Chainlink Labs offers Proof of Reserve service for embattled exchanges
⚽ After Breaking Up With EA, FIFA Has Announced 4 New Blockchain Games
Credits & Feedback
Today’s Litepaper was written by Jon Morgan. Let him know how he did: