Chart In Focus – Chinese Internet Stocks

Today we want to highlight an area of the market that market participants are watching to gauge the overall stock market’s next move. 👀

Below is a chart of the popular Chinese Internet ETF $KWEB, which was down 6.79% today as it fell to nearly 1-month lows. ðŸ”ŧ

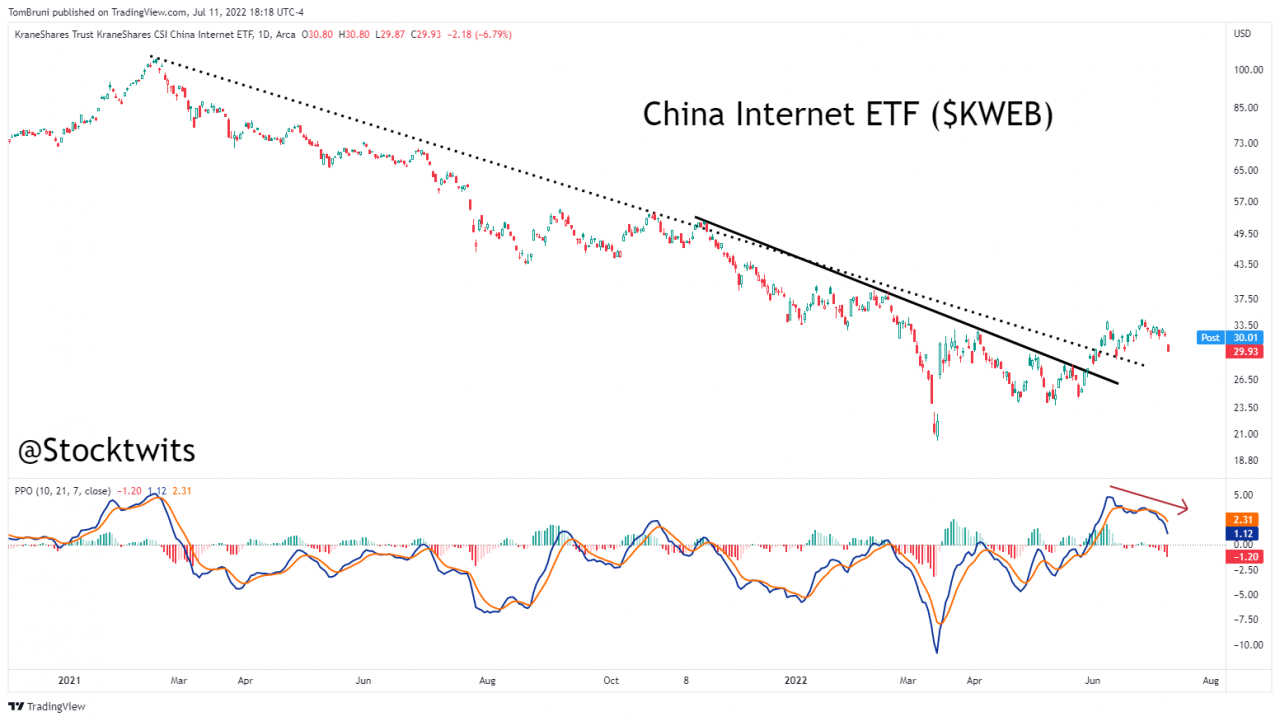
For the non-technical analysts out there, essentially, you’re looking at the ETF failing to make new highs a couple of weeks back as buying momentum waned. Now, it’s heading back to the downside in a sharp fashion.

And the reason why this ETF is in focus is because of its recent propensity to lead moves in the U.S. stock market in general. ðŸĶŪ

Its price topped in early 2021 before Technology stocks and other speculative assets in the U.S. started moving lower. And in March of this year, it put in a price low and began to move higher, even as U.S. technology stocks (and stocks in general) were continuing to the downside.

Additionally, it’s one of the riskier areas of the market due to its concentration of high-growth technology names, its exposure to Chinese regulators, and its high beta as a trading vehicle. ðŸ˜Ļ

So from a sentiment perspective, it offers a view of how market participants are positioning themselves — offensively or defensively. 

And right now, several market participants/analysts are viewing the recent move down as a potential leading indicator of more pain to come for stocks in general. 😎

We’ll be watching to see if this breakdown accelerates into a further decline. Or if this niche market barometer can find its footing in the days ahead.

Hop on the streams and let us know your thoughts as well! 💭

More in   Stocks

View All

How The Markets Performed In 2023

As our article about the ultra-wealthy showed, 2023 was a great year for assets (especially the publicly traded ones). Let’s take a quick peek at how things panned out. 👇

First, let’s start with the tech-heavy Nasdaq 100 index. The chart below shows that the index had one of its best rolling 12-month total returns in decades, rising 55%. The actual total return index also hit new all-time monthly closing highs, reiterating that bulls took back the momentum this year in a big way. ðŸĪĐ

Read It

Definitely “A” Top, Maybe Not “The” Top

We don’t want to say CNBC caused the top in Super Micro Computer Inc., but they definitely pushed sentiment over the edge. ðŸĪŠ

Mania’s are hard to time, but most market participants agree that today was “a” top in the stock. What we all fail to agree on is whether it was “the” permanent top. Let’s see how it played out. 👇

Read It

Microsoft Briefly Overtakes Apple

While most of the market focused on the spot Bitcoin ETFs beginning to trade today, the second-largest company in the world made a move on its sole competitor. ðŸ”Ū

This morning, Microsoft’s market capitalization briefly crossed that of Apple’s, making it the largest company in the world. While it didn’t last, it does beg the question of which stock will lead the market going forward.

Read It

Traders Eye IPOs Into 2024

After a rough patch from late 2021 through 2022, this year, the initial public offering (IPO) tried to make a comeback. Now, traders say 2024 could be the year this turnaround really comes. 👍 

Below is a chart of the Renaissance IPO ETF ($IPO), which is up about 53% so far this year. But technical analysts and traders say that its recent breakout to roughly eighteen-month closing highs signals a critical trend change in prices. They argue that prices staying above the 35-37 range, which has previously served as an inflection point in the stock, would suggest momentum has shifted firmly to the upside. 🙃

Read It