Another Type Of Apple Season

$AAPL, like the rest of the tech sector, has been hit hard in 2022. Selling pressure from sector exposure and the production slowdowns/shutdowns in China have weighed heavily on investors and Apple’s shares. πŸ“Š

But there is some reprieve coming. With China’s easing of lockdowns, J.P. Morgan analysts believe that the supply chain is likely to improve and is already showing signs of recovery.Β 

The primary Foxconn factory has reportedly recovered to about 70% of its capacity, bringing hopes that the newest iPhone models will ship out sooner. J.P. Morgan reported that the wait time for the latest iPhone model is down to two weeks versus 30-40 days.

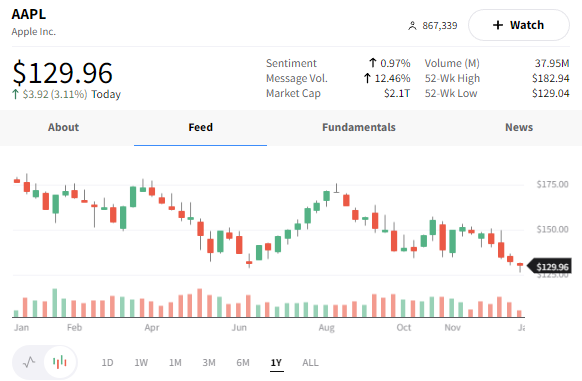
Apple is trading higher today at +3.14% at the time of writing. Technically, it is above yesterday’s open and is testing Tuesday’s close of $130.03 as resistance. 🍎

Learn More About...

More in   Stocks

View All

Trading Competitions: Week 4 Recap

This week’s competition was filled with new names, a change from the last few weeks when several long-term Stocktwits users dominated the leaderboards. But what didn’t change was traders making big gains; let’s see how they did. πŸ‘‡

Coming in third place was HaltTradeAlert, who made a bullish bet in the pharmaceuticals sector and delivered a 52% weekly gain. Next up was Chaz Russell, who posted a 179% gain after placing bullish bets on Netflix, Carvana, Meta, and other stocks across several sectors. πŸ‘€

Read It

Investors Ditch China For Nvidia

While everyone is looking at the S&P 500 closing above 5,000 as this week’s stat of the week, MarketWatch is flagging another wild data point. 🚨

As you can see from the headline snippet above, Nvidia is now worth as much as the entire Chinese stock market. While several stocks already have achieved this feat, they’re bigger conglomerates with many businesses under one roof. But Nvidia is a chip designer and manufacturer with a more straightforward business model, making this that much crazier of an occurrence.Β 

Read It

Traders’ Updated S&P 500 Roadmap

Just because the calendar changes dates doesn’t mean the market’s trends do. As such, now seems like a great time to update the S&P 500 roadmap many traders used throughout 2023. πŸ—ΊοΈ

Below is a two-year daily candlestick chart with a few key indicators. The first is the 200-day moving average (blue), which traders use to track the long-term trend in the market. The next two are the anchored volume weighted average price (AVWAP) from the market’s 2022 highs and 2022 lows. Traders use this to track how the average buyer/seller has fared in the market from a specific date.

Read It

Nvidia Tops Amazon

It seems like Nvidia is hitting a new milestone every day, so why would today be any different? 🀷

This morning, we saw a massive squeeze in shares of Arm Holdings, which soared more than 40% before pulling back midday. That led to other semiconductor stocks rising alongside it as investors’ optimism around the sector continued. πŸ“ˆ

Read It