Amid the market’s recent volatility, the talk of the trading community has been the 200-day moving average. 🗫
We’ve discussed this technical indicator somewhat regularly, but here’s a refresher. Technical analysts use moving averages to smooth out a price’s trend over the timeframe they’re analyzing. And to simplify things, when prices are above the indicator, it’s often viewed as a bullish sign. Conversely, when prices are below the indicator, it’s often regarded as a bearish sign.
Those interested in tracking an asset’s longer-term trend often use the 200-day simple moving average. And the reason it’s back on people’s radar today is that the S&P 500 is trading right around its 200-day moving average. As are the other major U.S. indexes and many of the world’s largest stocks. 🤔
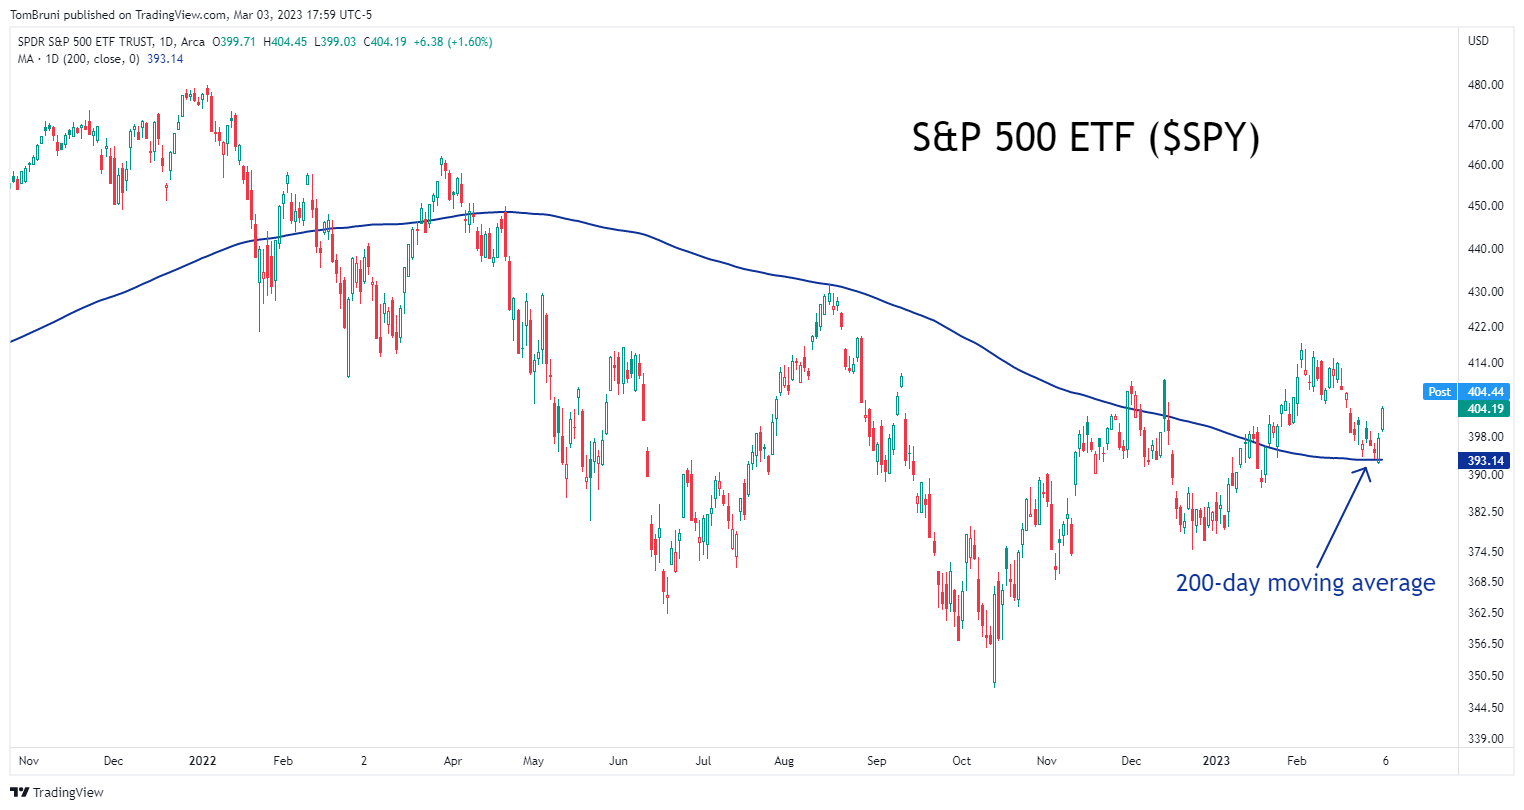
As we can see below, the S&P 500 ETF’s trend has flattened out after declining since last May. Bulls argue this signals a trend change is taking place. However, bears push back and say that prices have chopped around this indicator for several months, with the market unable to decide on a direction.
Whether or not these indicators hold any statistical weight is hotly debated. As with most market analysis tools, everyone has their own interpretation of how they should and should not be used. 🤷
With that said, the bulls are back, pointing out that the market did reverse sharply after running into this indicator earlier in the week. As a result, some are using it as their “line in the sand” for the market. If prices stay above it, then that’s bullish. And if prices fall back below it, then it’s bearish. Or so they claim…
We’ll have to wait and see what happens from here. But it’s clear that this is a level market participants are watching closely in the week(s) ahead. 👀