It’s been a wild week for bank stocks, so let’s take stock of where they all stand after today. Though before we get into some charts, let’s recap today’s news stories related to the sector.
First up, SVB Financial Group, the parent company of Silicon Valley Bank, has filed for Chapter 11 bankruptcy protection. The company says this process will allow it to evaluate strategic alternatives for its unaffected businesses and assets, including SVB Capital and SVB Securities, which remain operational. Also, note that Silicon Valley Bank was not included because it was taken over by the Federal Deposit Insurance Corporation (FDIC) last week. ⚖️
SVB Financial Group has roughly $3.3 billion in unsecured debt and $3.7 billion in stock that will likely be eliminated during the bankruptcy process.
Meanwhile, President Biden is calling on Congress to strengthen accountability for executives involved in the bank failures. Some ideas floated to discourage excessive risk-taking include clawing back executive pay, imposing fines, and preventing them from retaking jobs in the banking industry. 📝
And the soundbite that’s going most viral today is one in which Treasury Secretary Janet Yellen confirmed that only banks that pose a systemic risk would receive similar treatment as Silicon Valley Bank. Senator James Lankford used his line of questioning to point out that there are two classes of banks, those that the government will step in to help and those that it will not. 😮
While this was obvious to many market participants already, hearing Yellen say it so candidly sent most of FinTwit and the media into a frenzy. It also sent smaller community and regional bank shares lower as fears that deposits will continue to flee to larger “too big to fail” banks continue to spread. 😬
This is truly incredible.
Here is an exchange with Senator James Lankford & Yellen.
He asks, "Will every community bank … get the same treatment as SVB?"
Yellen: "Banks only get the treatment if … the failure to protected uninsured depositors would create systemic risk." pic.twitter.com/JvAX3Hhb6F
— unusual_whales (@unusual_whales) March 17, 2023
And internationally, Credit Suisse shares tumbled another 7% on news that it’s borrowing up to 50 billion Swiss francs ($54 billion) from the Swiss National Bank. Executives have a long weekend ahead as they discuss scenarios for the bank as it struggles to survive. 🏦
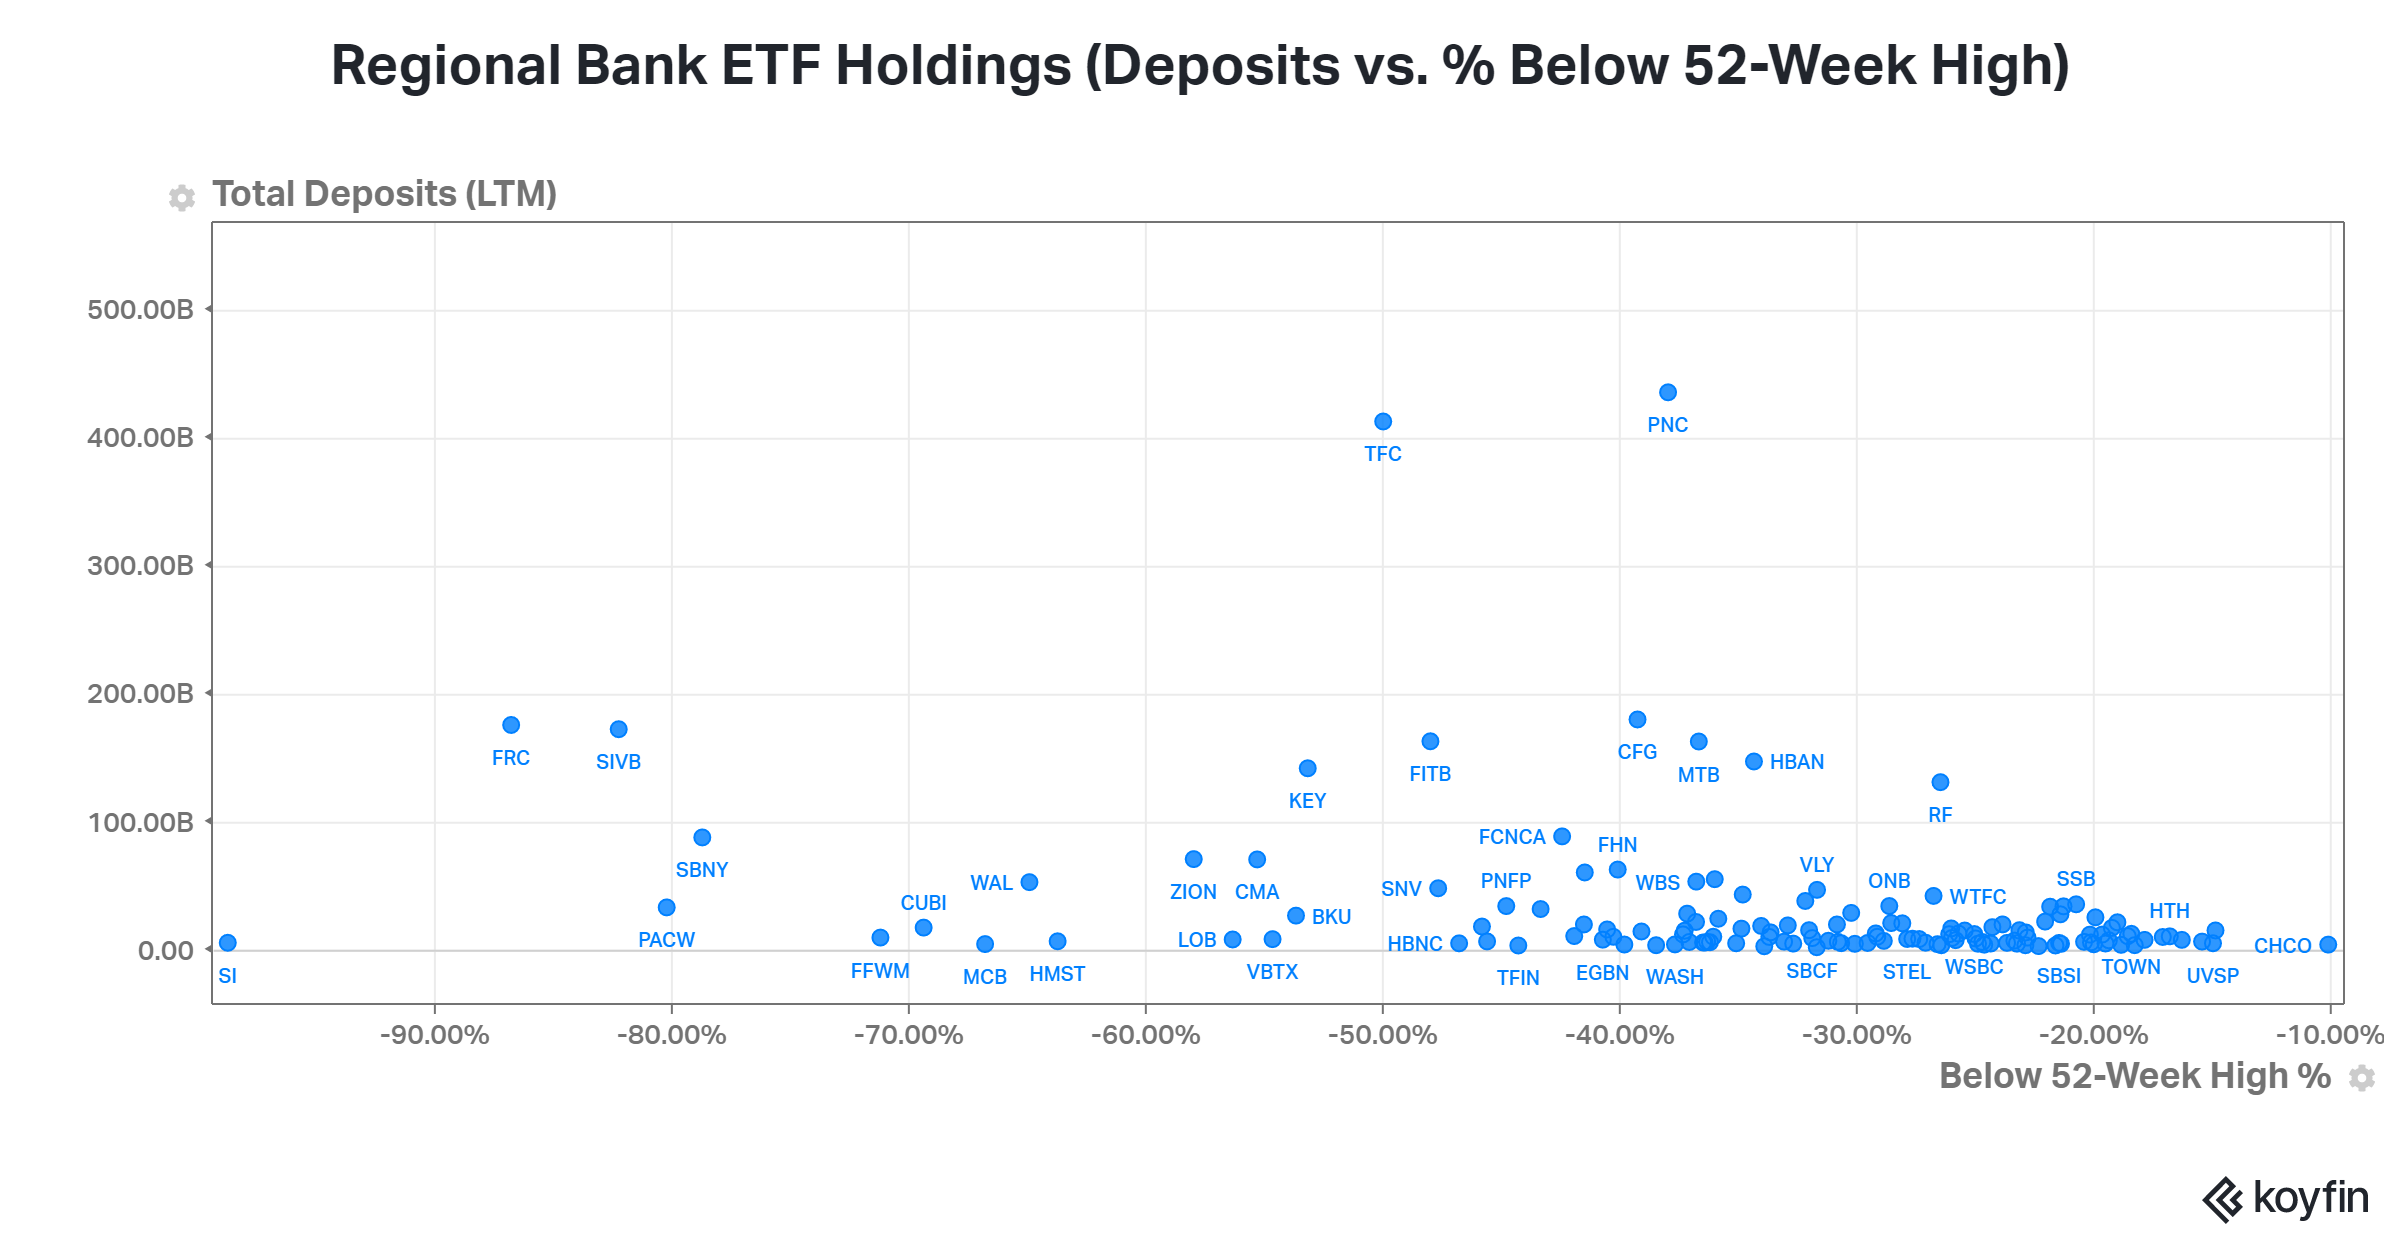
Since regional banks are the big focus these days, below we’re looking at its holdings. In it, we’re plotting their total deposits and how far the stock is below its 52-week highs. This can help provide some context as to the relative size of each of these banks, as well as how much they’ve fallen in price recently. 🤔
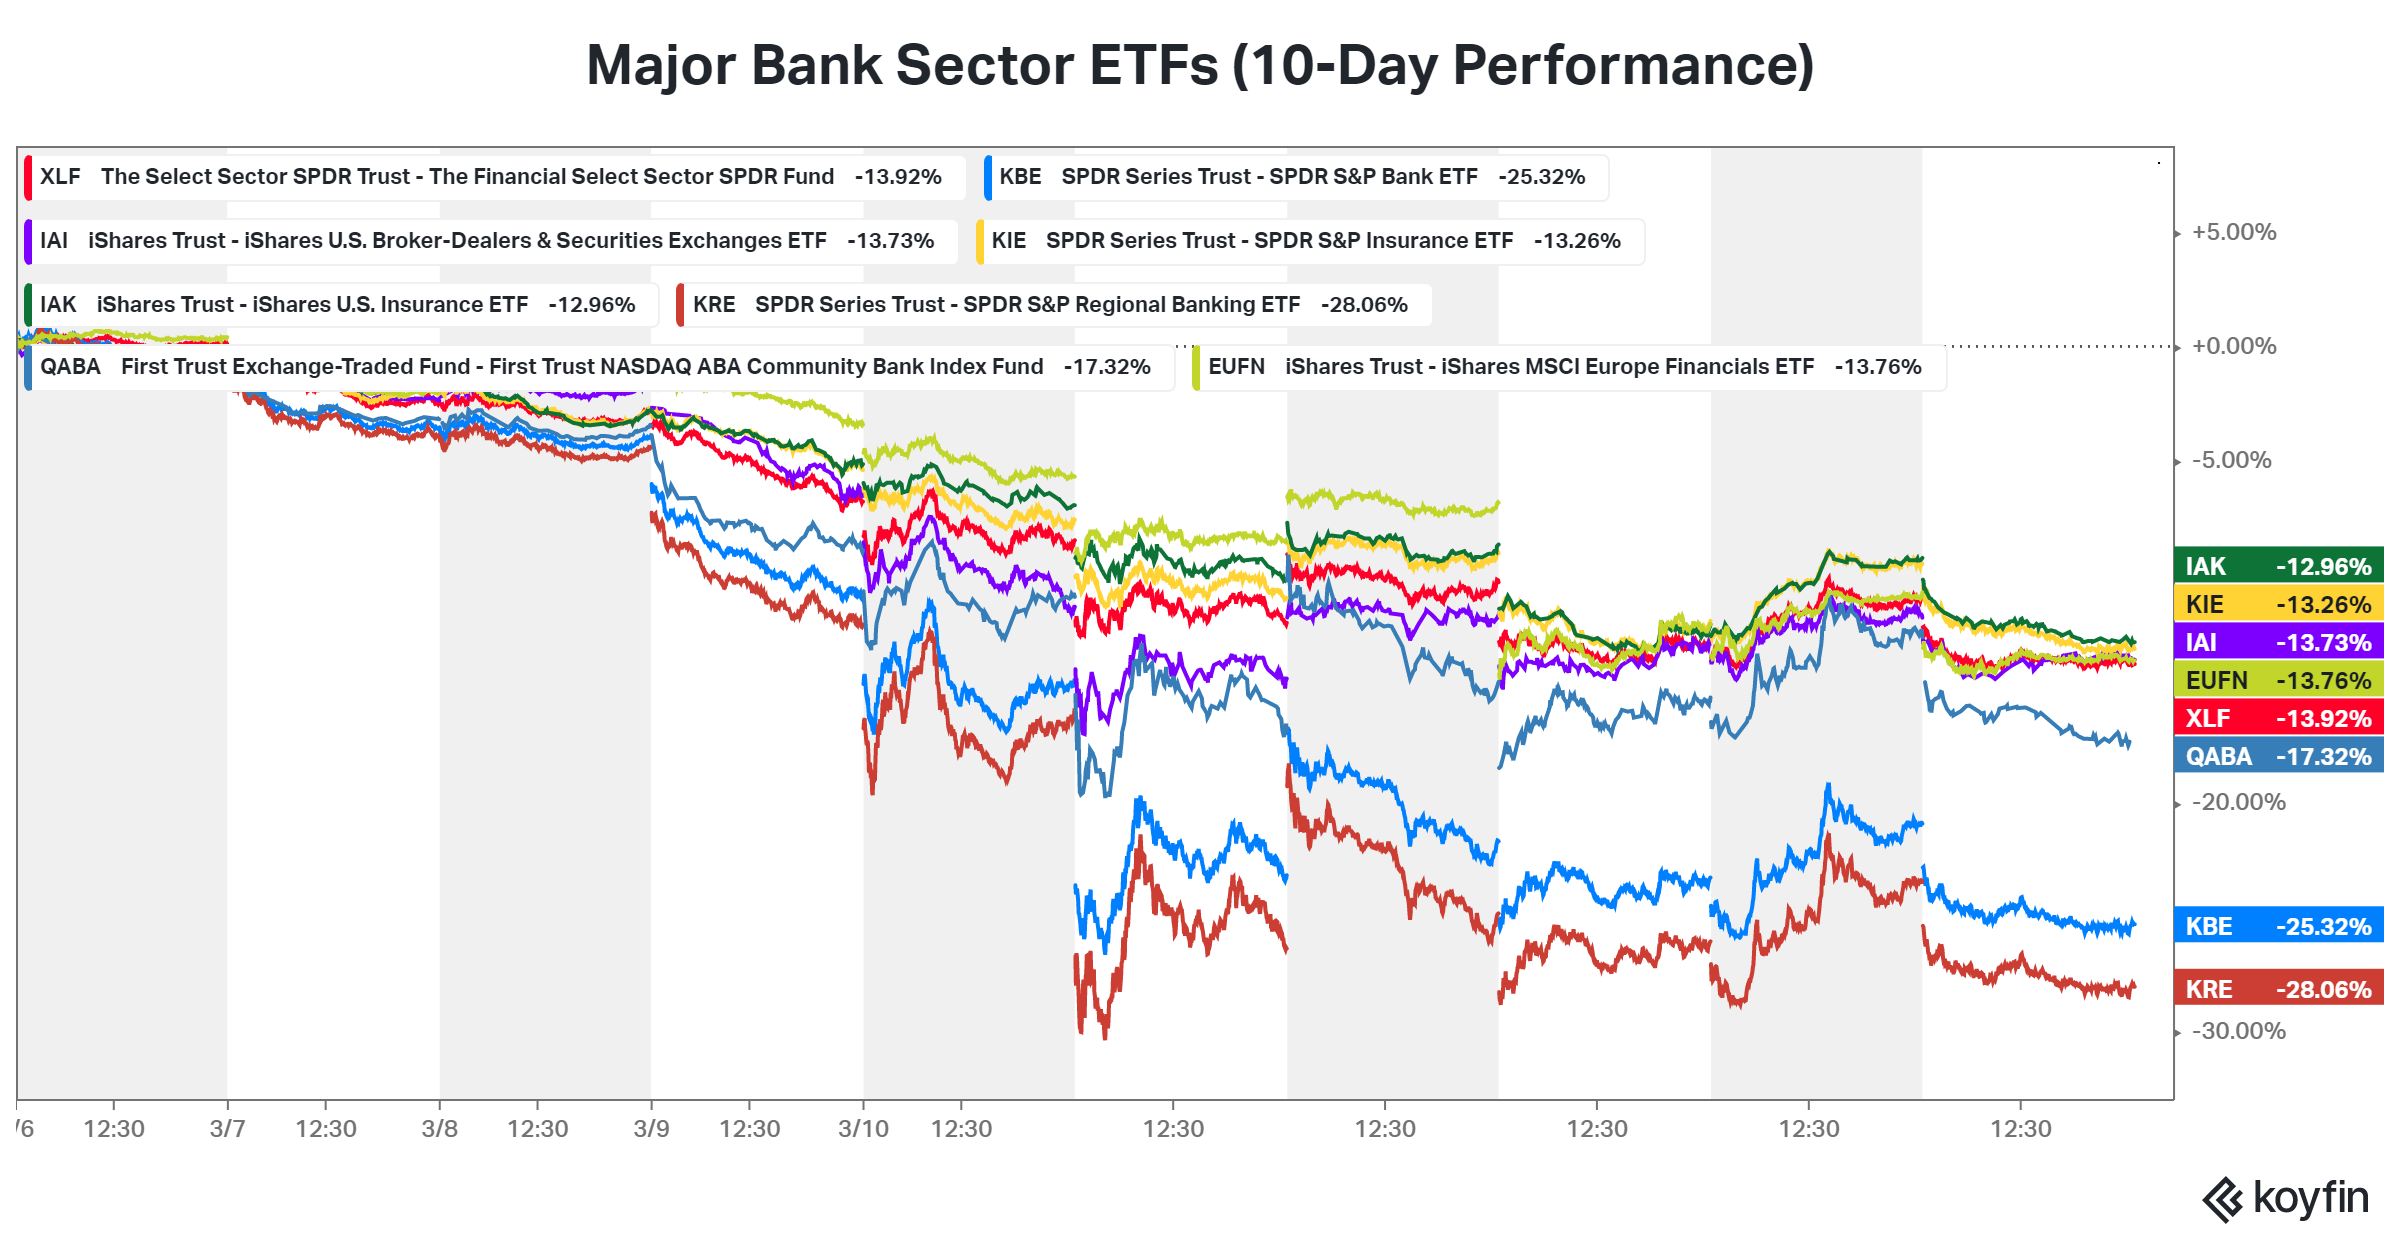
And below is the 10-day performance of various bank sector ETFs. They range from the major banks down to regional and community banks. We’ve even included insurance, capital markets, and other industry ETFs because they’ve all been hit hard.
Needless to say, it’s been a rough two weeks, and the volatility doesn’t seem to be slowing down. As always, we’ll keep on top of it and update you as the situation develops. 🤪