If $BTC.X continues to fall, how low could it go?
That’s the main question analysts, traders, and investors want to know – especially going into the weekend. 🤔
Let’s take a quick peek at what the analysts are looking at. And it’ll be quick.
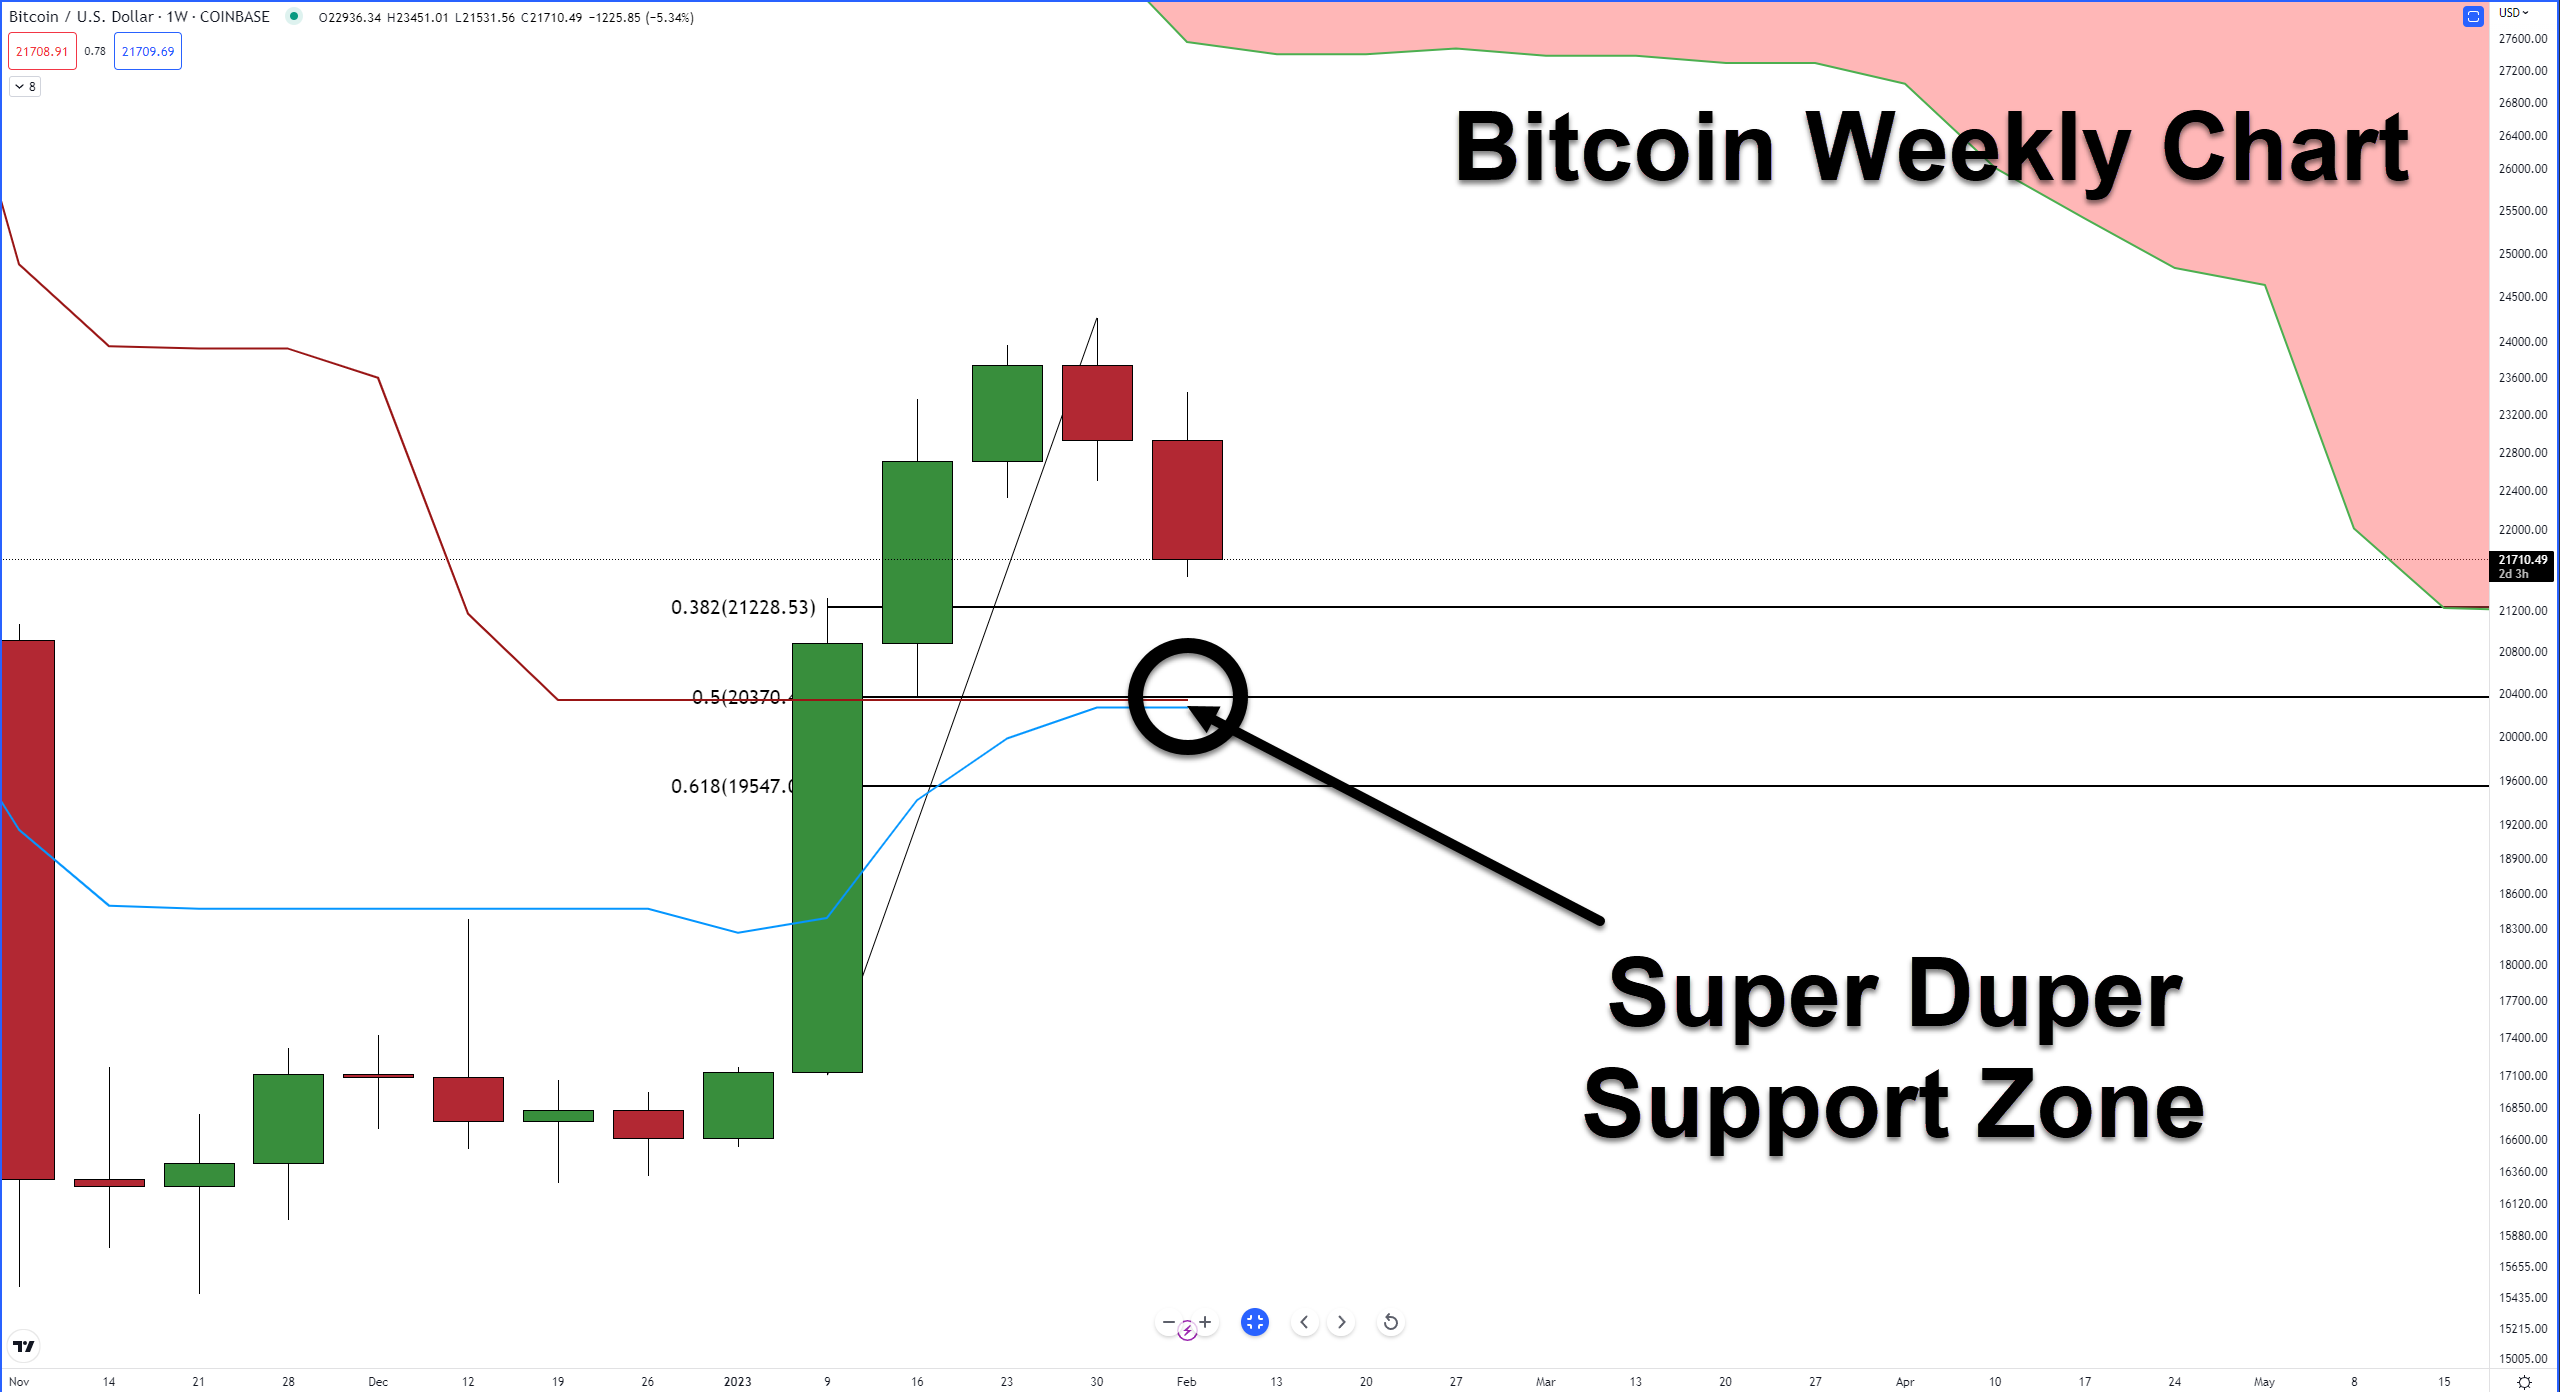
$20,370 – that’s the major support zone traders, investors, and analysts are paying attention to. Why? Four reasons:
- $20,370 is close to the psychological number of $20,000.
- $20,370 is the 50% Fibonacci retracement from the swing high of $24,262 to the low of the strong bar at $17,102.
- $20,370 is near the Weekly Kijun-Sen ($20,337).
- $20,370 is near the Weekly Tenkan-Sen ($20,267).
That’s a big chunk of technical support levels sitting right on top of one another. If it holds as support, analysts believe another leg up is likely.
However, if $20,370 fails to hold as support… well, that could be a warning that the bear market could continue. 🐻
And if you didn’t read or forgot about the Rising Wedge pattern, give it another look from Wednesday’s Litepaper.
The drop was the most probable direction from a technical analysis perspective, even before the SEC’s Kraken decision.