While the global economy and markets have softened throughout the year, the labor market has remained a bright spot. We’ve written extensively about the subject because it’s hard to talk about the Federal Reserve’s war on inflation without discussing how a tight labor market keeps upward pressure on wages and overall inflation measures.
Additionally, it seems that every day there’s a new headline about labor unions demanding more for workers and companies in the service industry raising incentives to attract talent. On the other hand, technology companies continue to cut jobs and freeze hiring as their growth slows. So it indeed remains a “tale of two labor markets.”
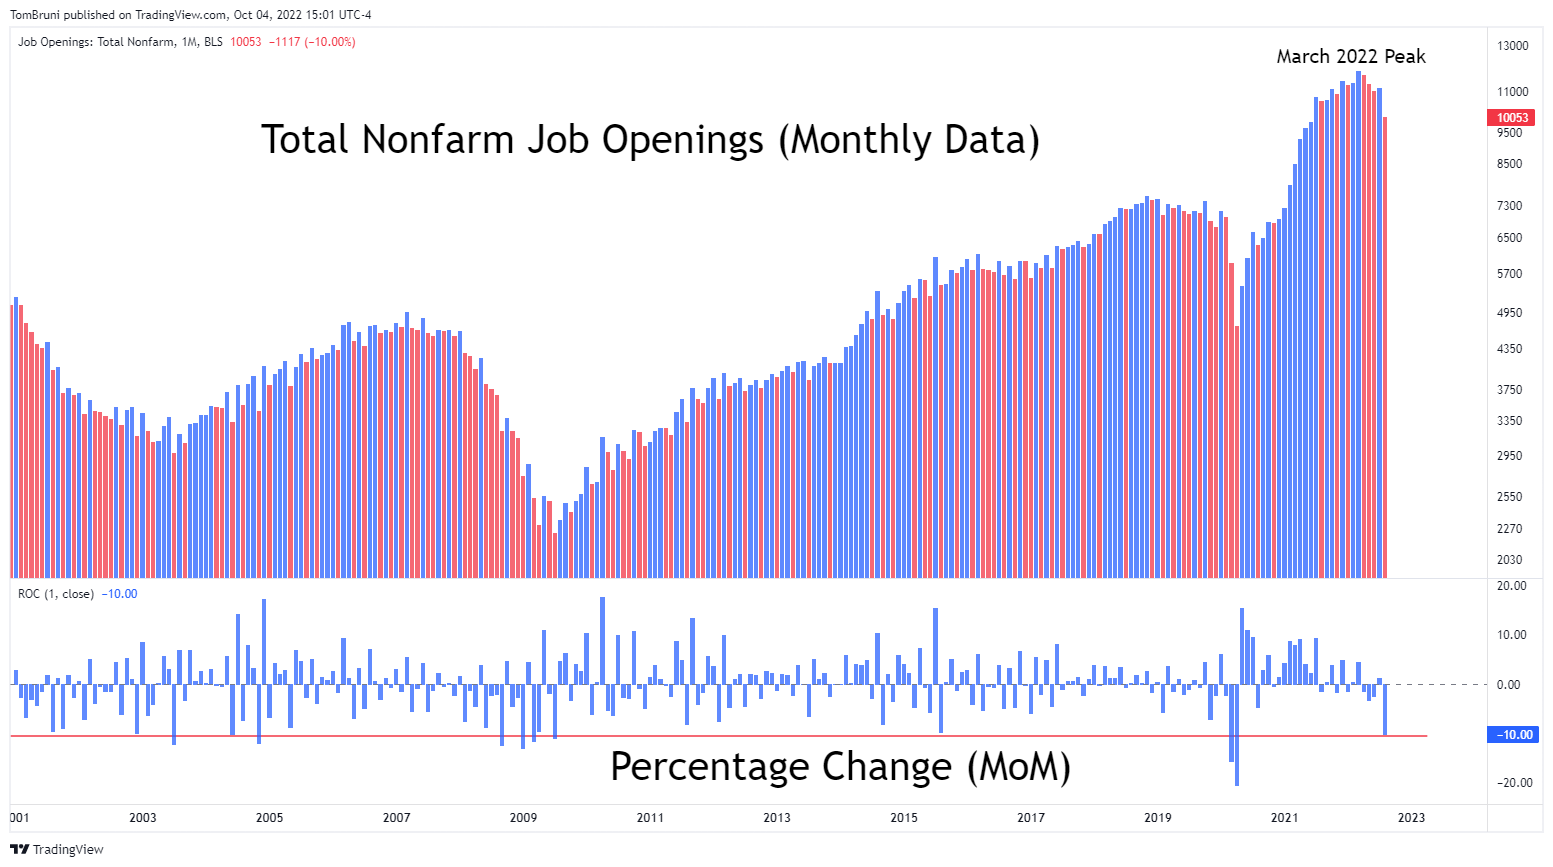
With that said, today’s JOLTs data (Job Openings and Labor Turnover Survey) was the first significant sign suggesting that strength may be waning. ⚠️
Today’s report showed that U.S. nonfarm job openings fell about 10% from July to August, from 11.17 million to 10.05 million. As we can see from the chart below, the 10% MoM decline is one of the largest on record dating back to the early 2000s. It also shows that job openings peaked in March of this year at around 11.85 million and have been slowly falling since.
So why is this relevant? Well, job openings tend to be a leading indicator of other employment data to come.
Let’s think about this logically. 🤔
If you’re a business that’s preparing for an economic downturn, you’ll likely start your cost-cutting efforts by making do with the employees you have. In other words, you’ll hire fewer people and ask your current employees to take on more tasks. If your business prospects continue to decline, you’ll reduce staff through layoffs or firings. That will show up in the initial and continuing jobless claims data and, eventually, the unemployment rate. And if your business continues to decline, you might find yourself shutting down and becoming an unemployment statistic yourself.
So what we’re really looking at in this data is the tip of the proverbial iceberg. While the drop is a major one, and we’re trending lower from March’s peak, the number of job openings vs. available workers remains very elevated at around 1.7:1. Additionally, the quits rate remains elevated, and the other measures of labor market stress remain historically low. 🔻
By most measures, the labor market remains stronger than it’s been in a very long time. With that said, today’s data may be an indication of further softening to come.
The Federal Reserve has told us it will not stop until inflation nears its 2% long-term target. It’s aiming to bring down demand by tightening financial conditions, with Powell specifically noting the housing and labor markets as its primary targets in recent speeches. 🎯
What this all means for the stock market remains to be seen. But what’s clear is that the U.S. labor market is cooling as demand softens across the global economy.
And if we needed any more confirmation than the four million articles we’ve referenced in our past issues, check out a couple of headlines from today: Amazon Freezes Corporate Hiring in Its Retail Business and Facebook to purge thousands of workers as part of ‘quiet layoffs’: report. 📰