The stock market reversed sharply today, and many are pointing to treasury yields as the cause. Let’s find out why. 👇
Last week we discussed how much of the stock market’s gains since October have come from multiple expansion, not earnings growth. Essentially, investors have been willing to pay more for every dollar of earnings S&P 500 companies generated. However, that was primarily driven by the belief that interest rates and inflation had peaked and rates would come down.
Yesterday’s Federal Reserve press conference reiterated that the committee remains open to another rate hike before the end of the year. It will depend on the data, which is mixed right now. Core and headline inflation continues to trend lower (albeit slowly), and the housing market has stalled. But the labor market remains historically strong and is buoying consumer confidence and spending. 💪
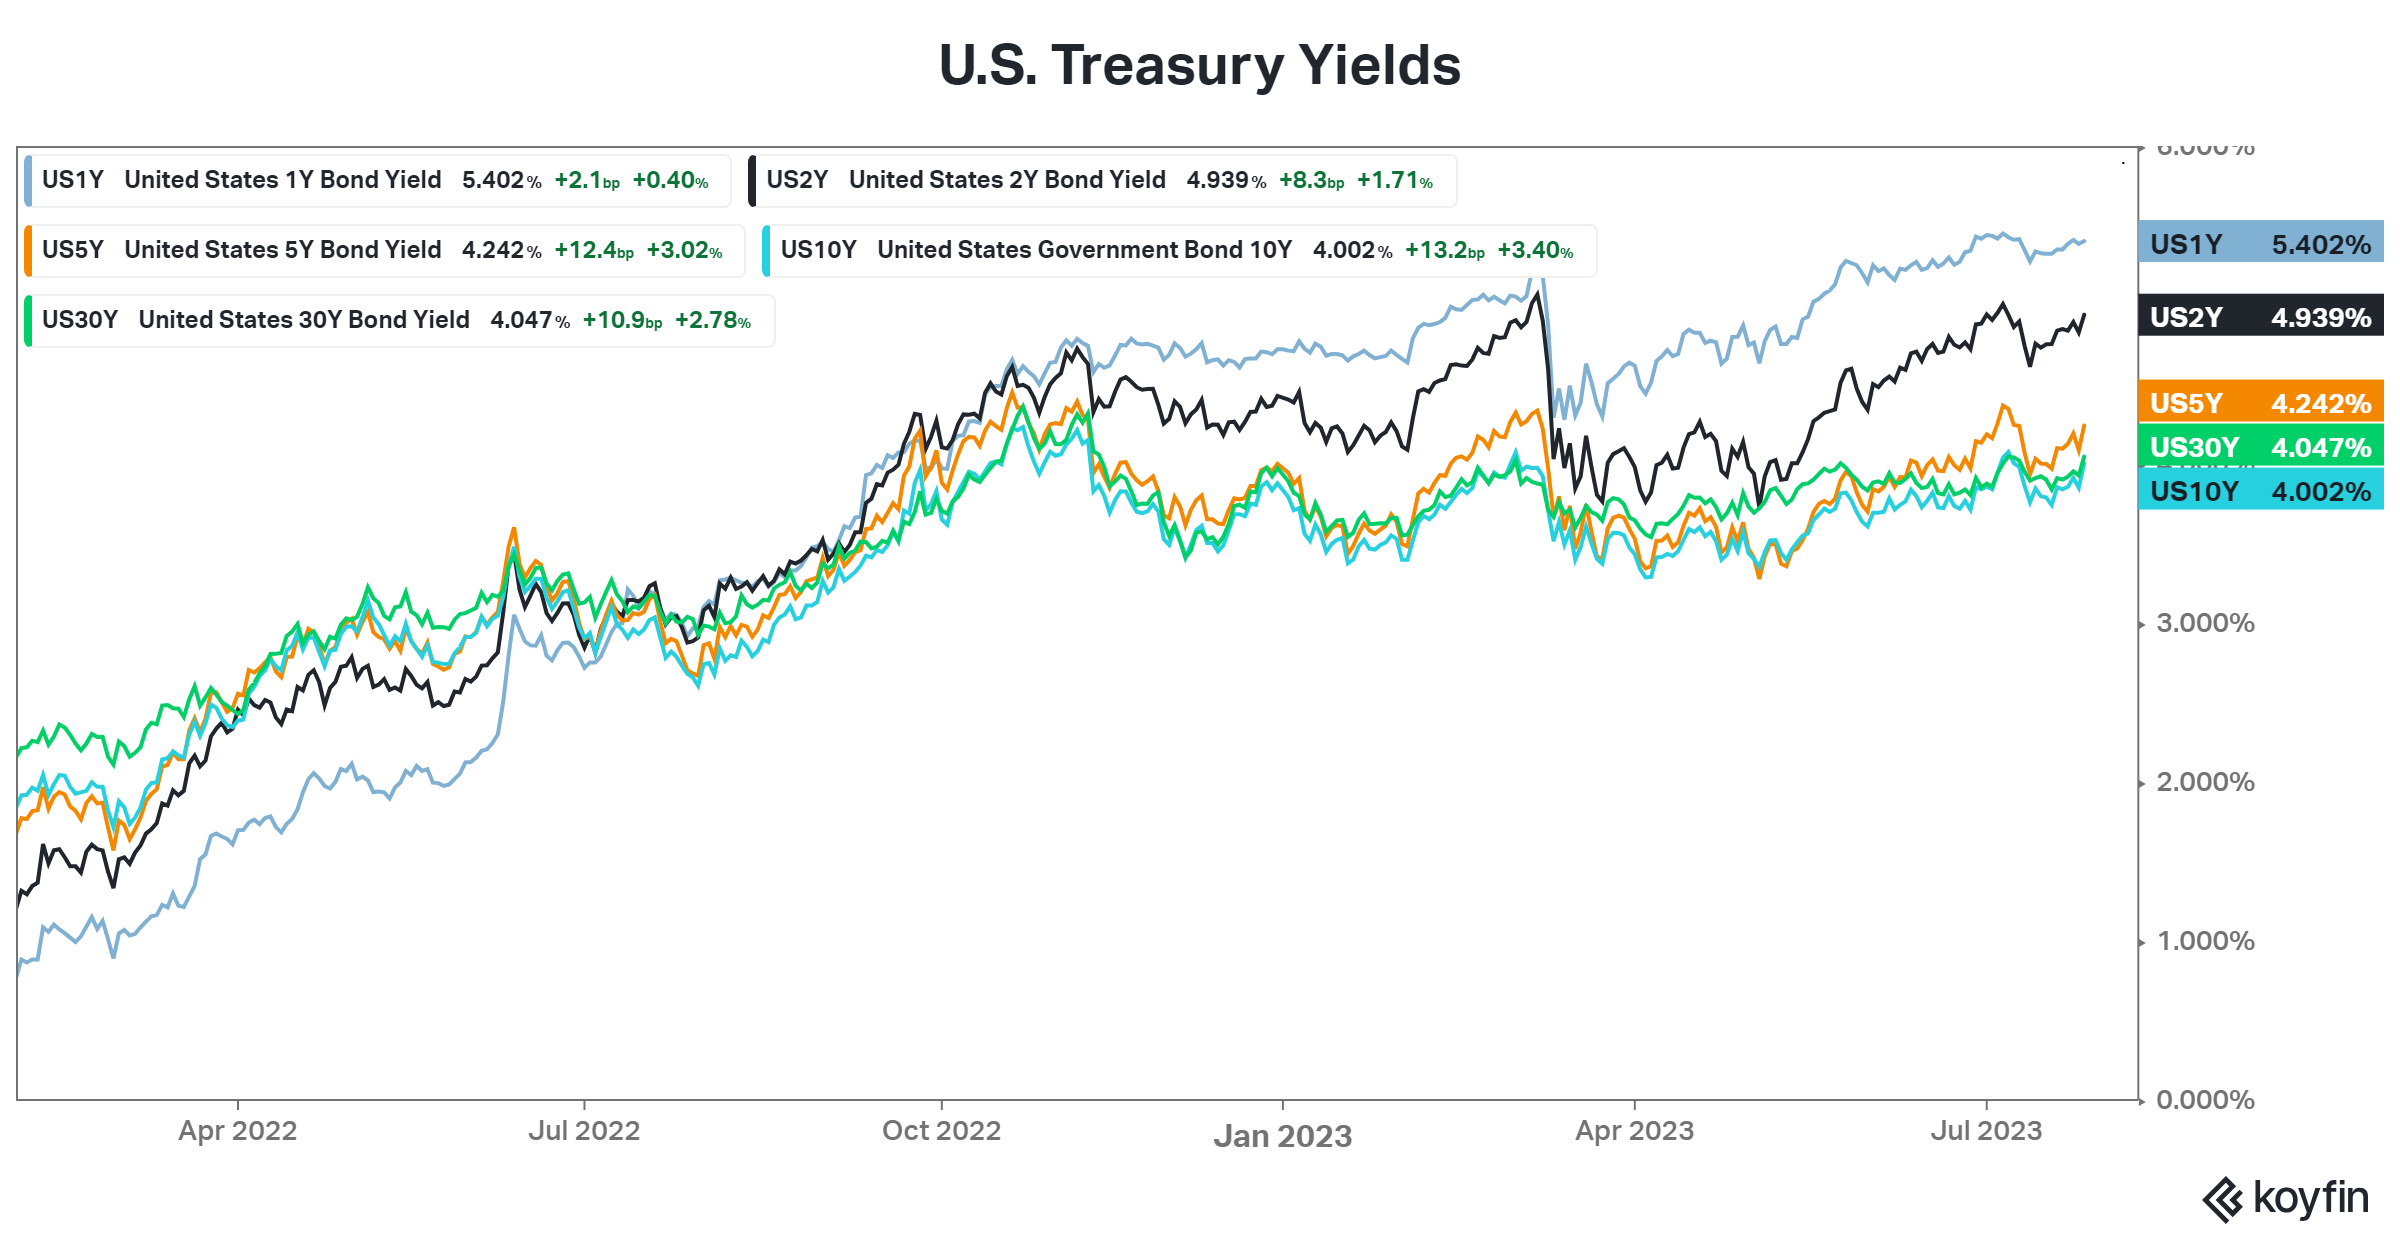
Today’s second-quarter GDP report came in at 2.4%, showing that the economy remains more resilient than even the Fed anticipated. And if that’s the case, rates may have to adjust higher than they are. That’s why Treasury Yields across the curve pushed higher today, with the U.S. 10- and 30-year yields topping 4% again.
The chart below shows that longer-term rates have held steady since October as the market bet on a Fed pivot. But the economy never weakened, and the Fed hasn’t changed its tone materially. As a result, we may be witnessing the early stages of a breakout in yields. That’s at least what shook the stock market today. 📈
Stocks across the board have rallied significantly, and earnings haven’t been there to support them. Many companies have said their pricing power is diminishing as inflation comes down, but costs remain elevated due to the tight labor market. And if interest rates continue to move higher from here, then it will only be more difficult for companies to generate better margins and earnings. 🐻
As a result, some market analysts believe today was the start of a short-term pullback. Many are pointing to the “bearish engulfing candles” taking place in the major indices like the Russell 2000 and many individual stocks. 🐻
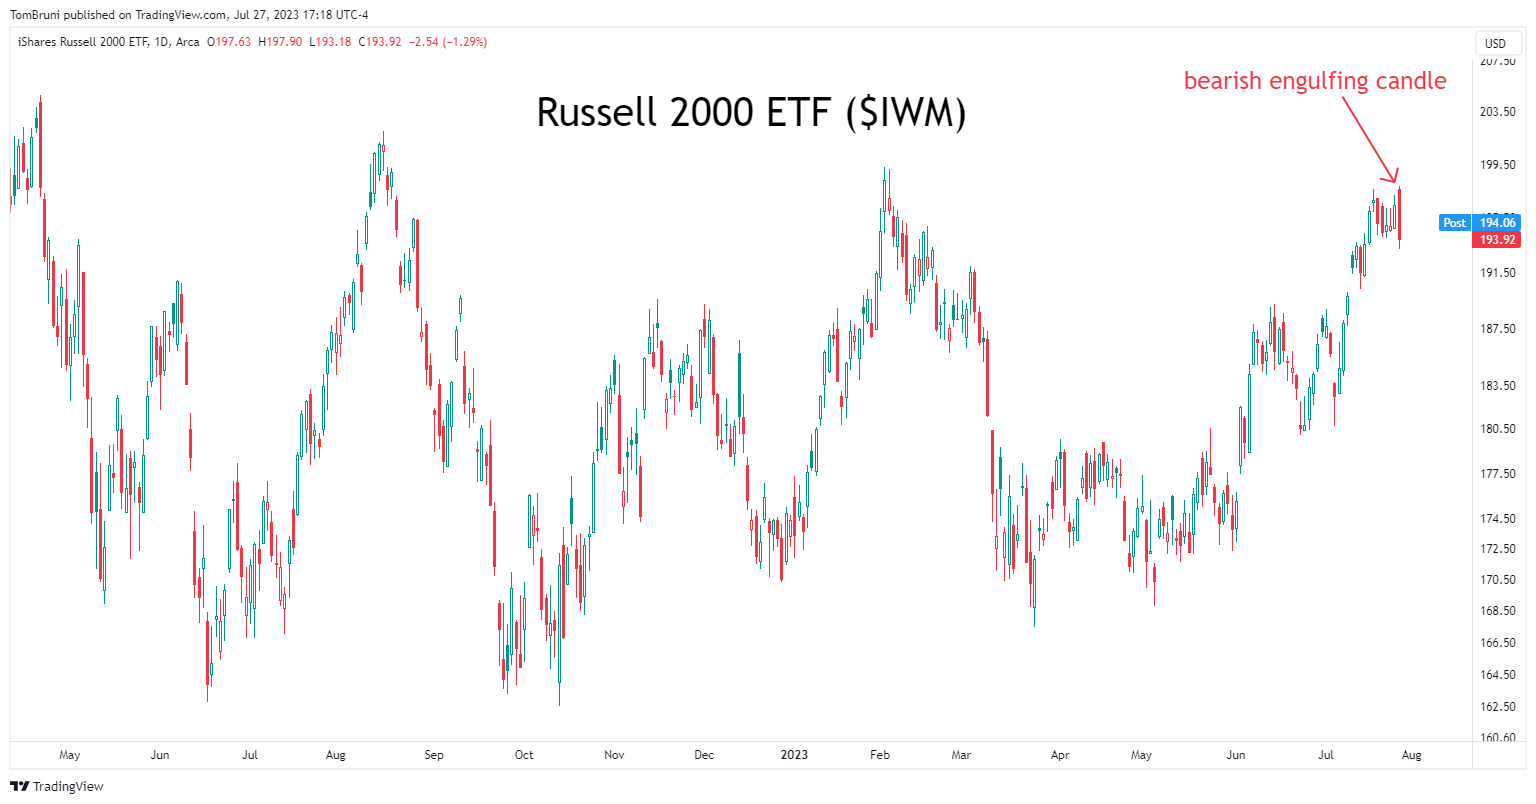
This technical analysis pattern is the opposite of its bullish counterpart and essentially signals the start of a potential trend change. However, this signal requires downside follow-through in the days after to confirm that sellers have taken control. 📉
Overall, after a strong run in the stock market, bulls are looking for the next catalyst to take the market higher. With high valuations and prices rallying sharply since October, many fear that there are more potential bearish catalysts than bullish ones. Time will tell, but at least now you know the prevailing narrative. 🗫